RORTS CENTRAL (An Update August 2022)
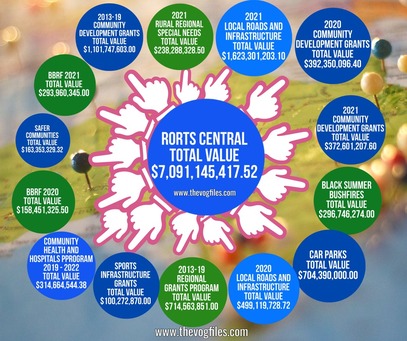
We have now Analysed $7 billion+ worth of grants given out by this Coalition Government."Where has the Fair Go Gone?" Pork Barrelled that's where.
|
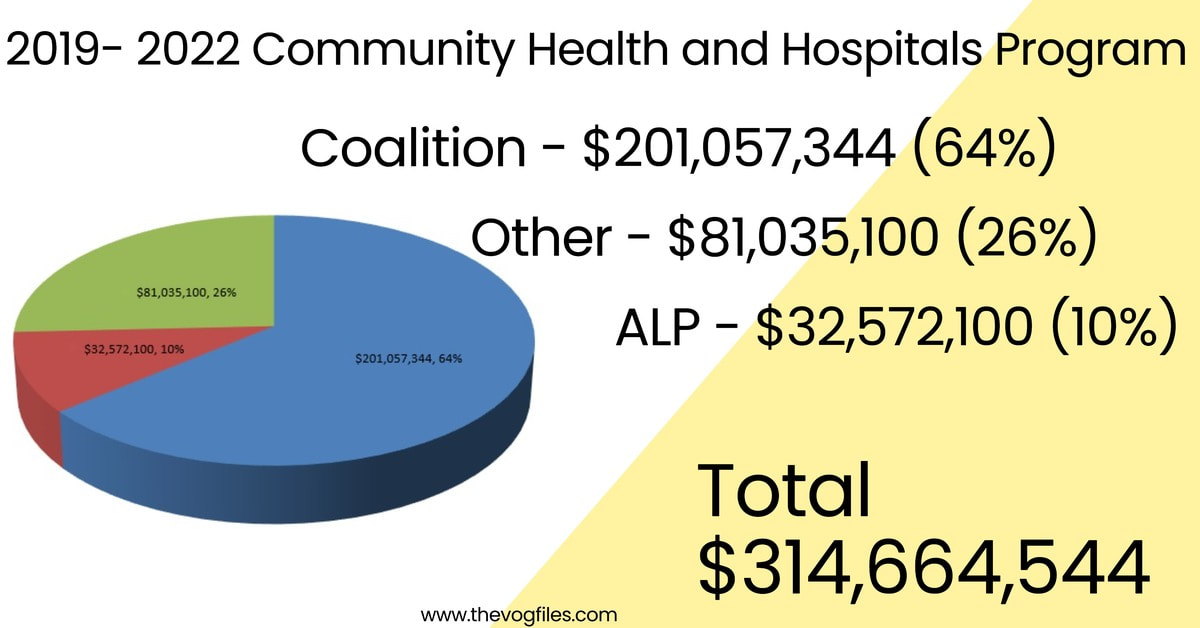
Our most recent analysis on the Community Health and Hospitals program has just been added.
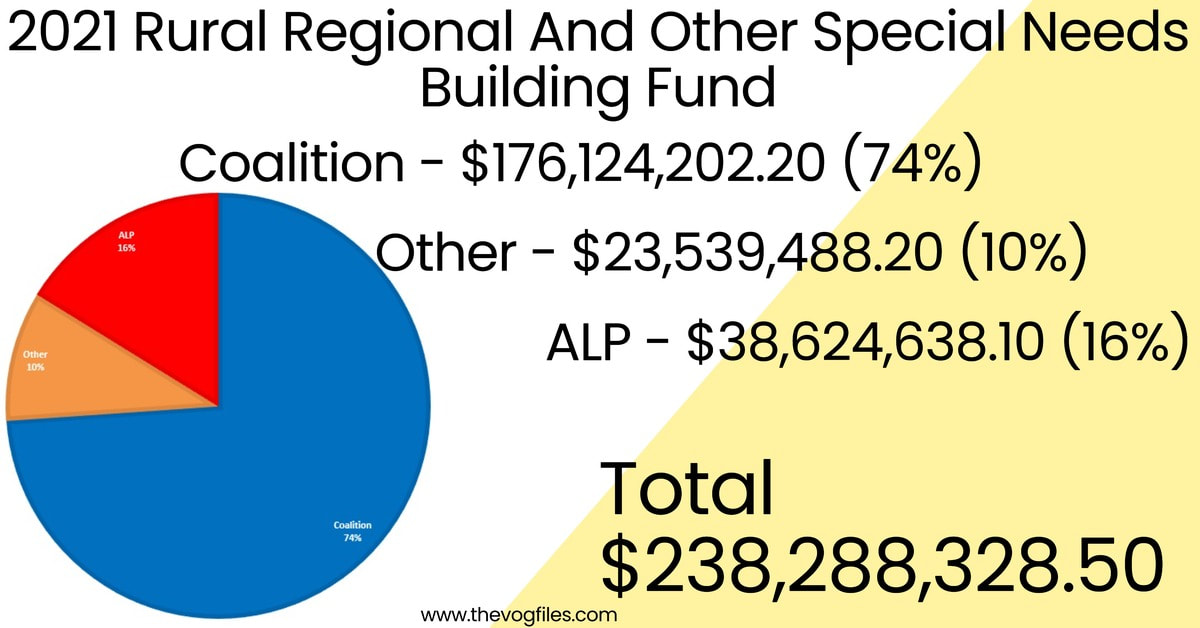
So lets update you with the latest programs analysed. No 1. Rural, Regional and other Special Needs Building fund.
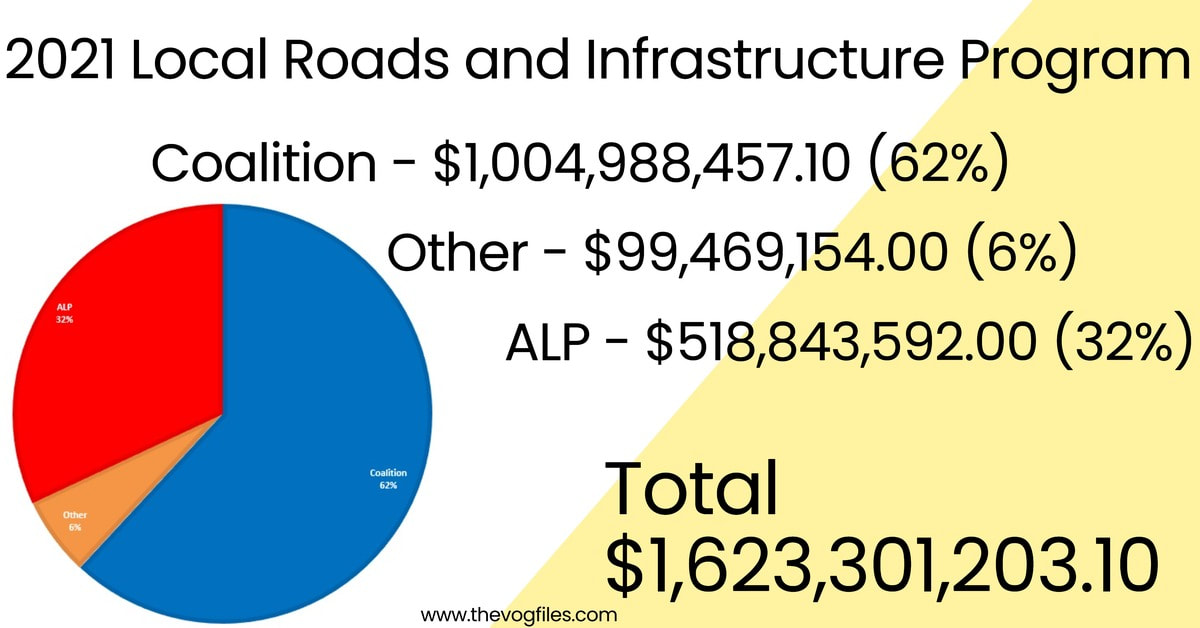
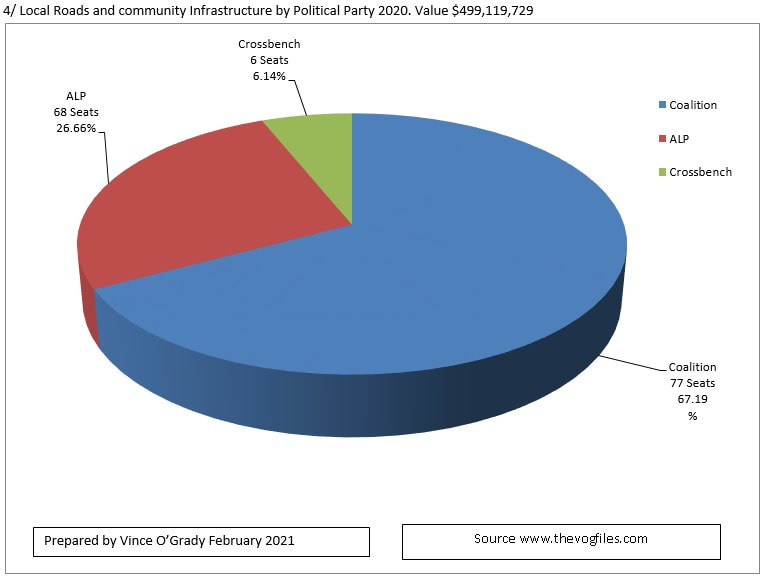
No 2. Local Roads and Community Infrastructure Program.
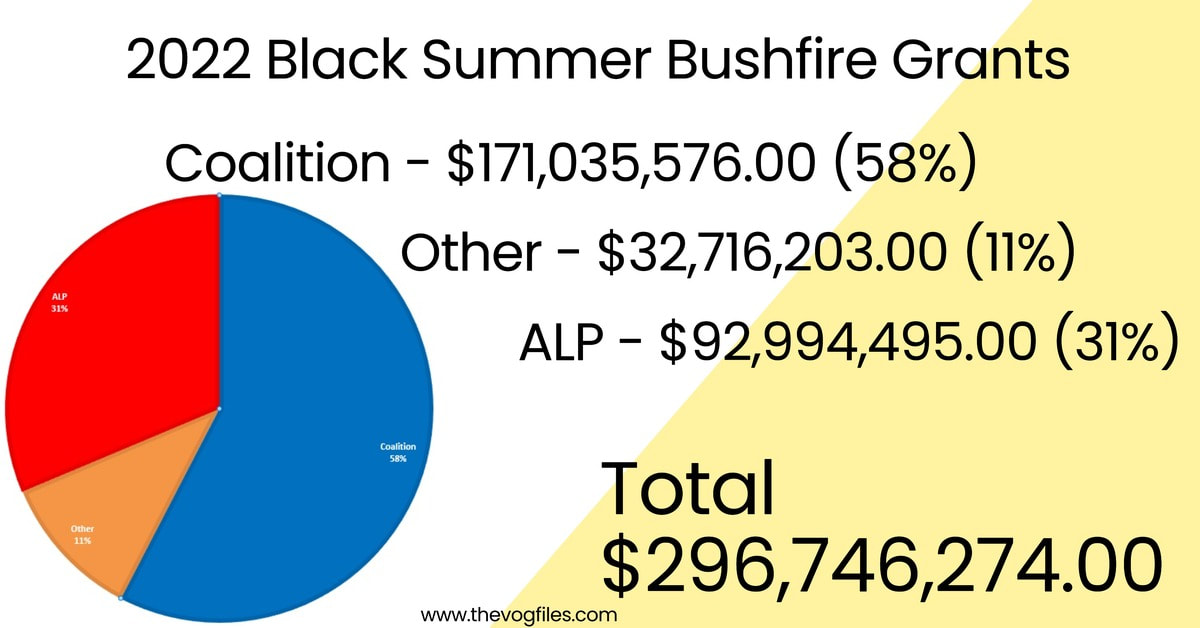
No 3. Black Summer Grants.
|
The FILESSpecial Projects |
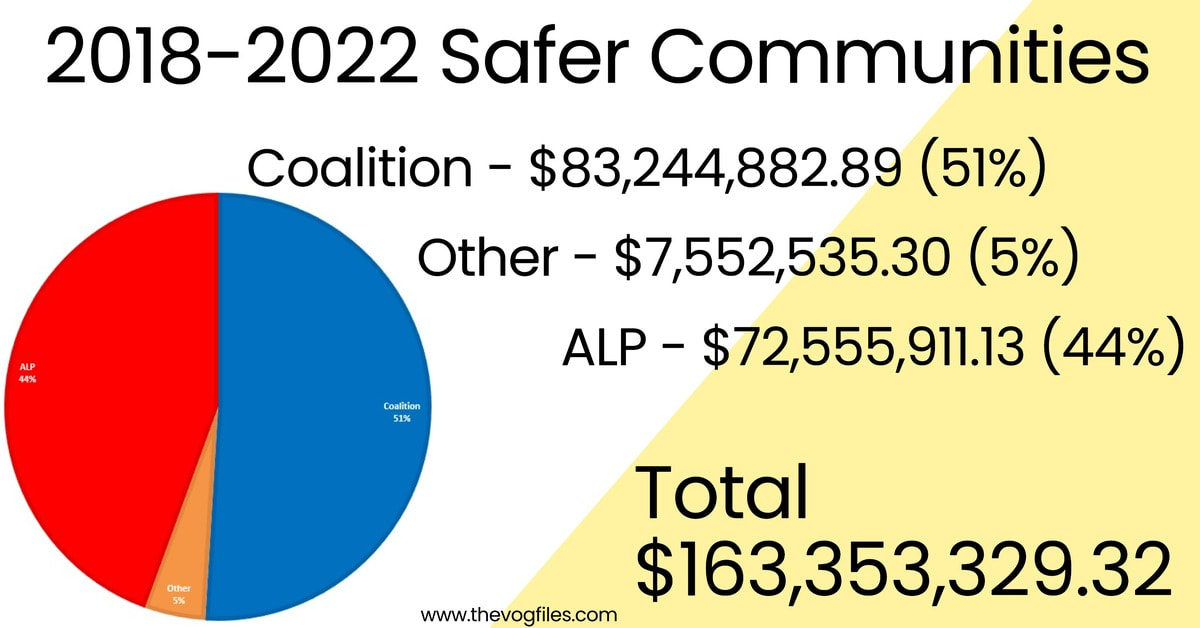
No 4. Safer Communities. Targeted at religious groups.
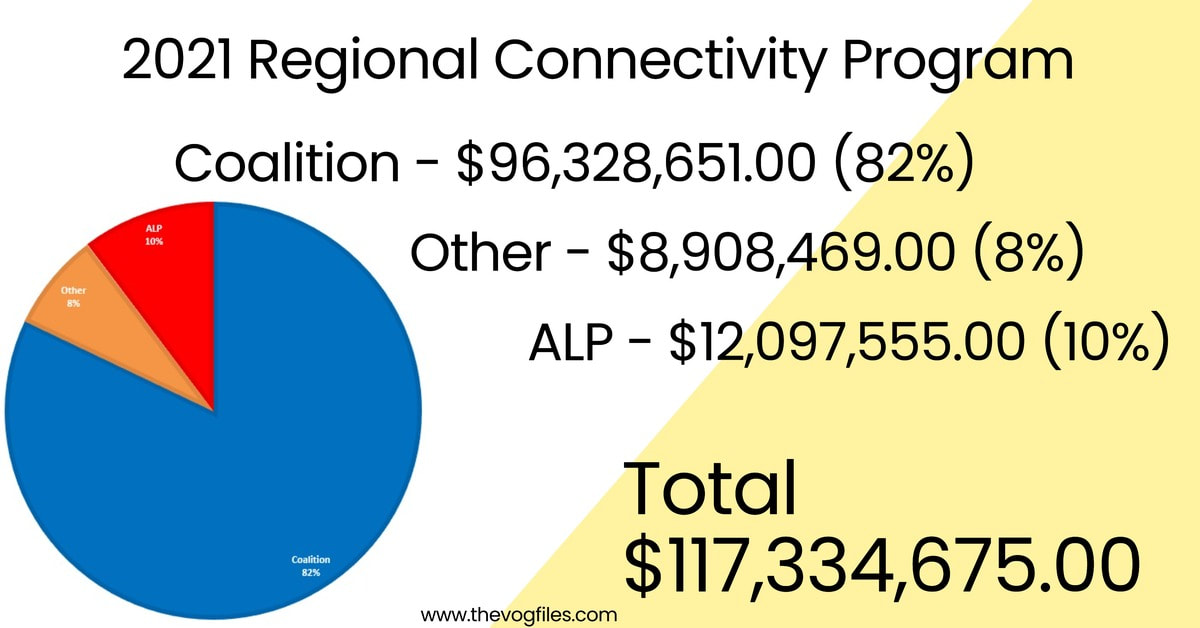
No 5. Regional Connectivity Program. Fixing up certain NBN foul up's for mates?
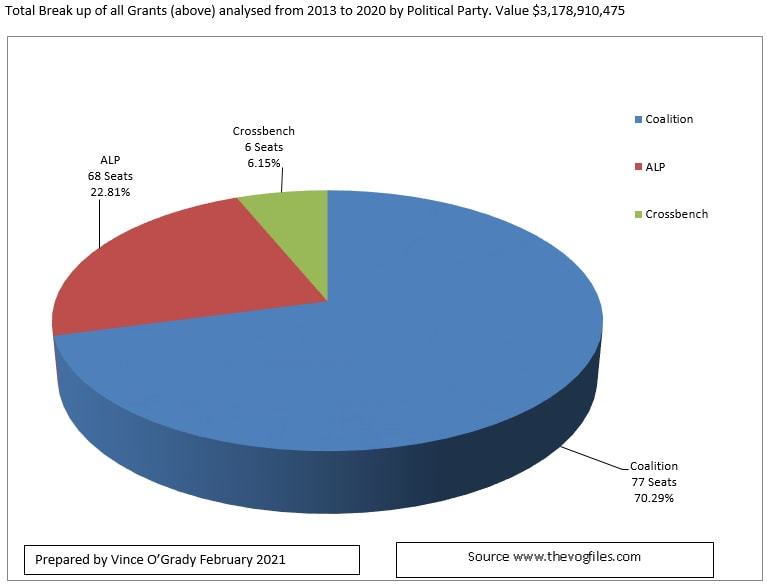
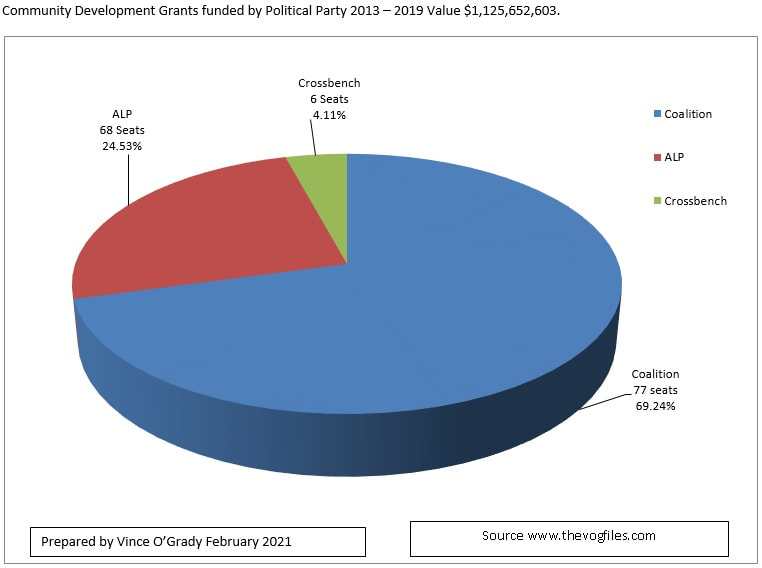
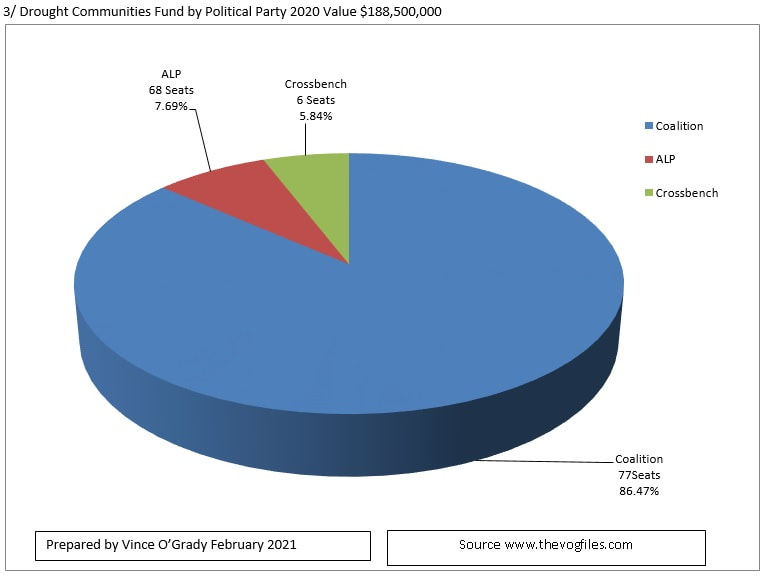
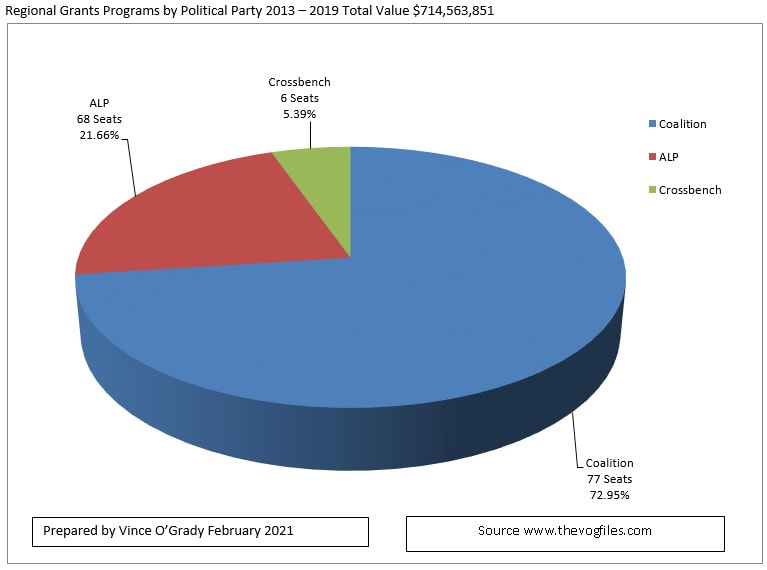
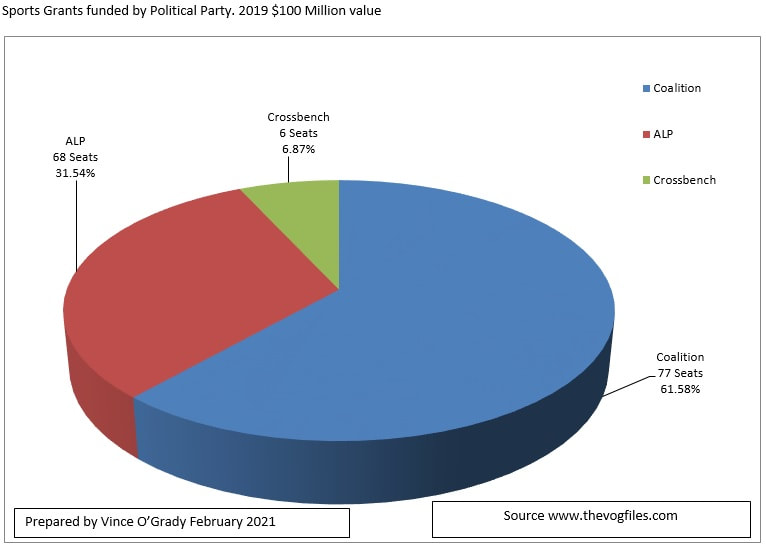
As you can see the Distribution is skewed to the coalition Seats big time. Labor have 68 Seats and the Coalition have 77 so you would expect the distribution to be fairer. But it's not. Let us remind you of the 9 other Programs we have analysed.
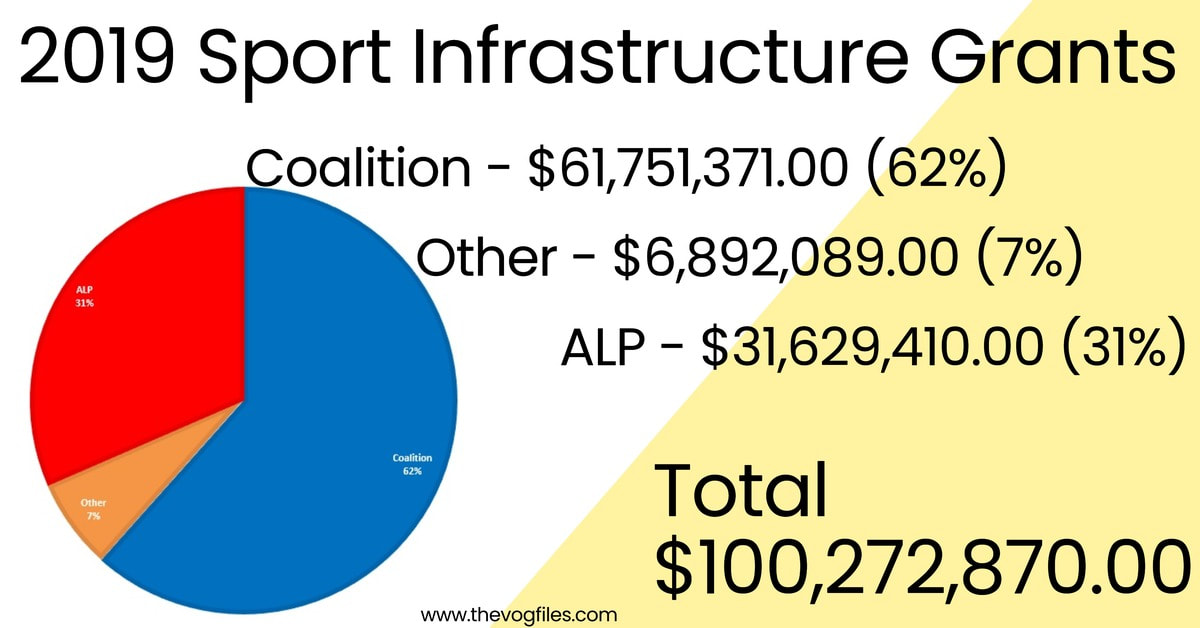
No 6. Sports Infrastructure Grants. The $100 million scheme that started this all off.
No 6. Sports Infrastructure Grants. The $100 million scheme that started this all off.
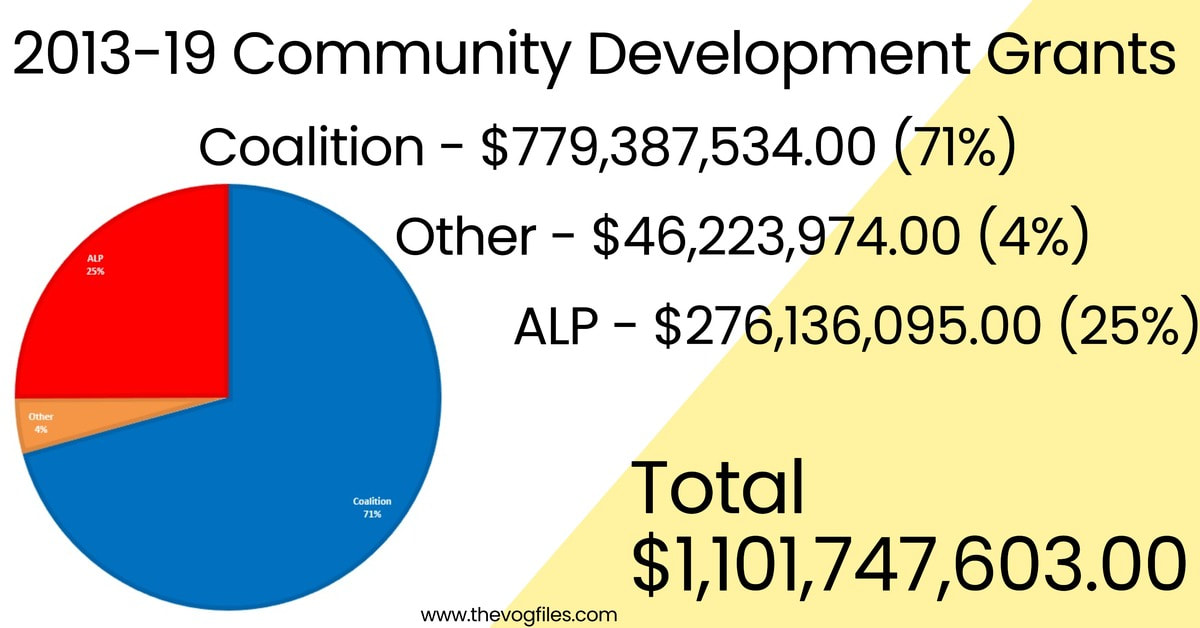
No 7. Community Development Grants.
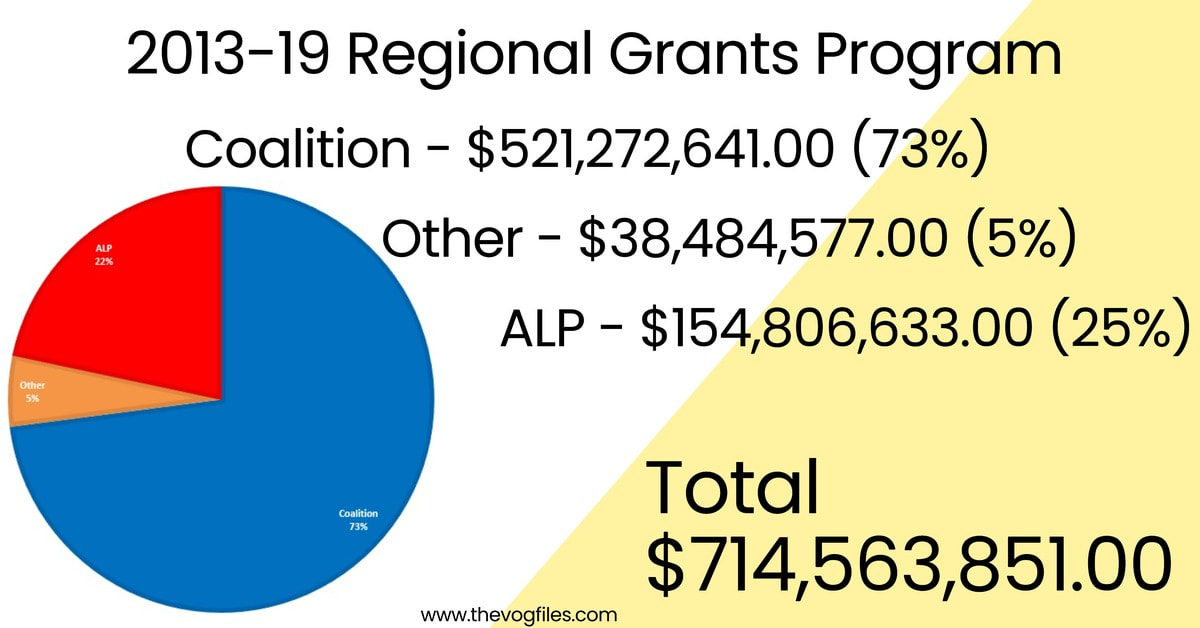
No 8. Regional Grant Programs.
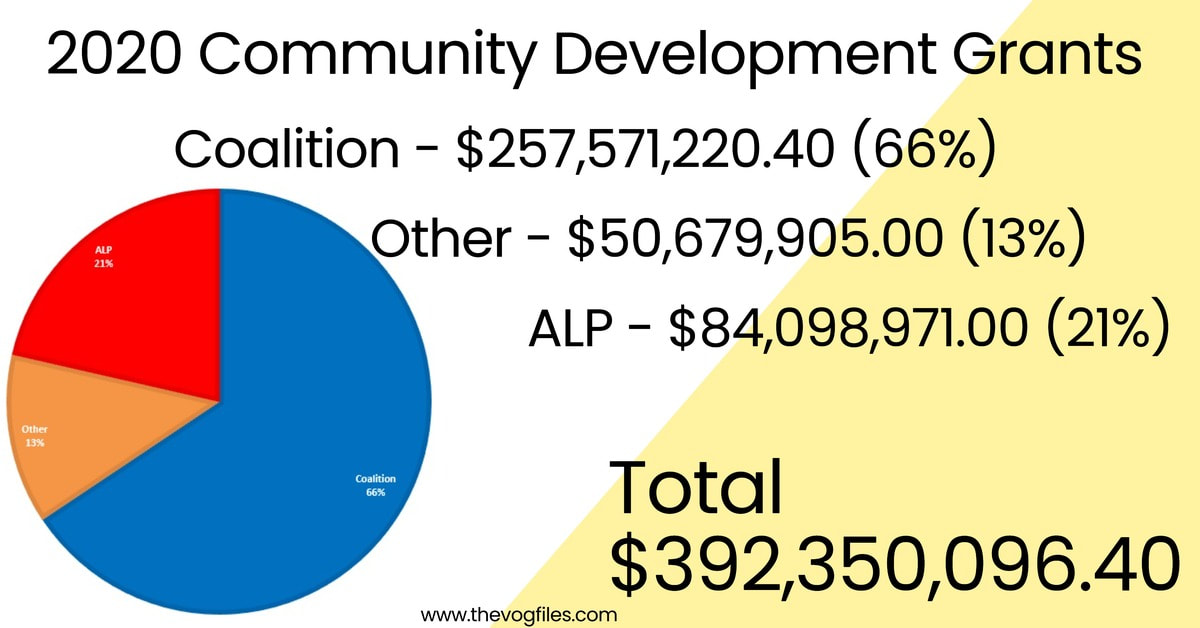
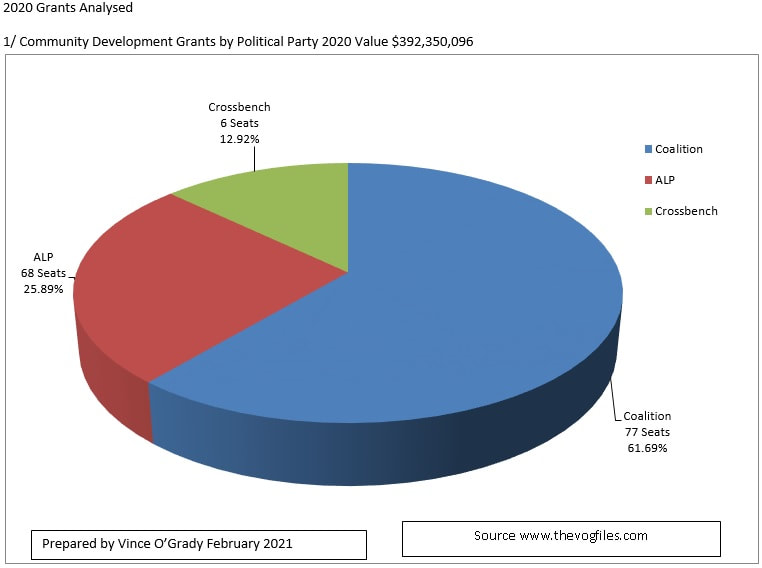
No 9. Community Development Grants 2020
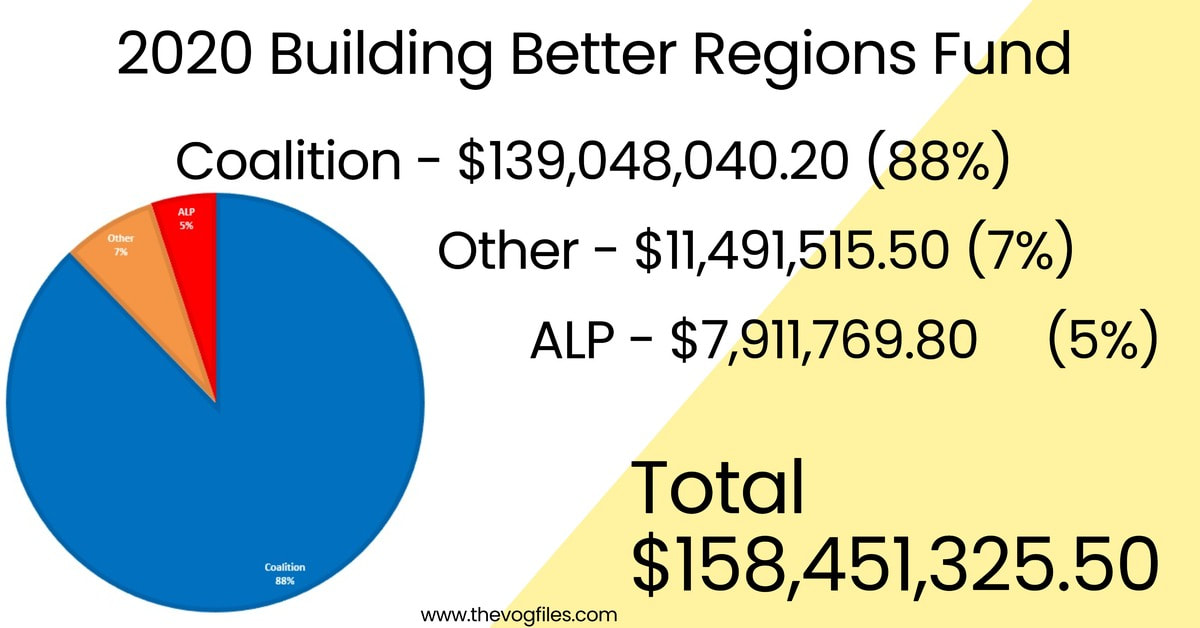
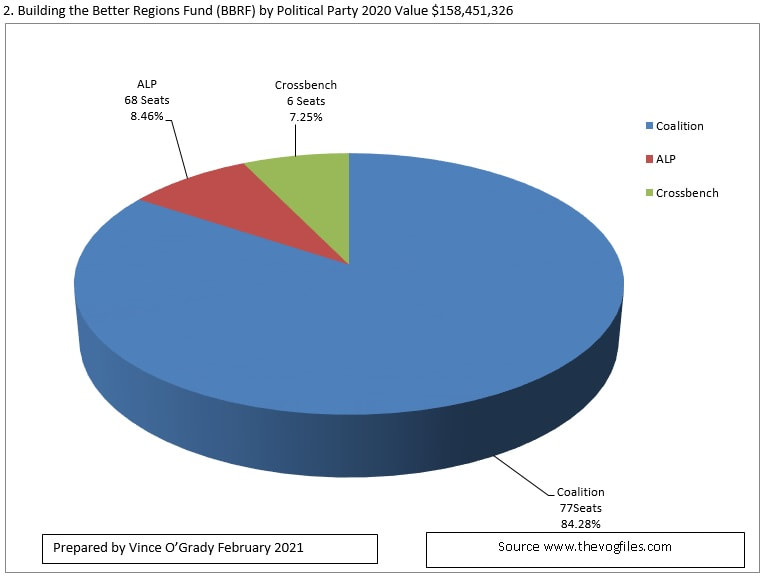
No 10. Building The Better Regions Fund 2020. Currently being Audited by the Auditor General.
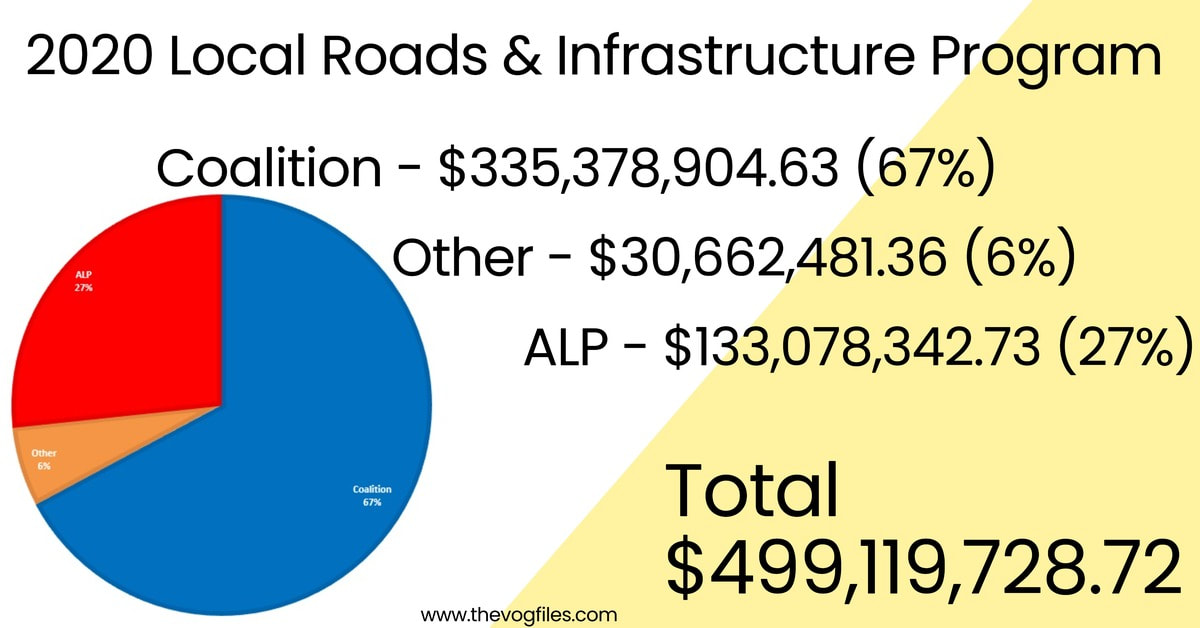
No 11. Local Roads and community Infrastructure program 2020.
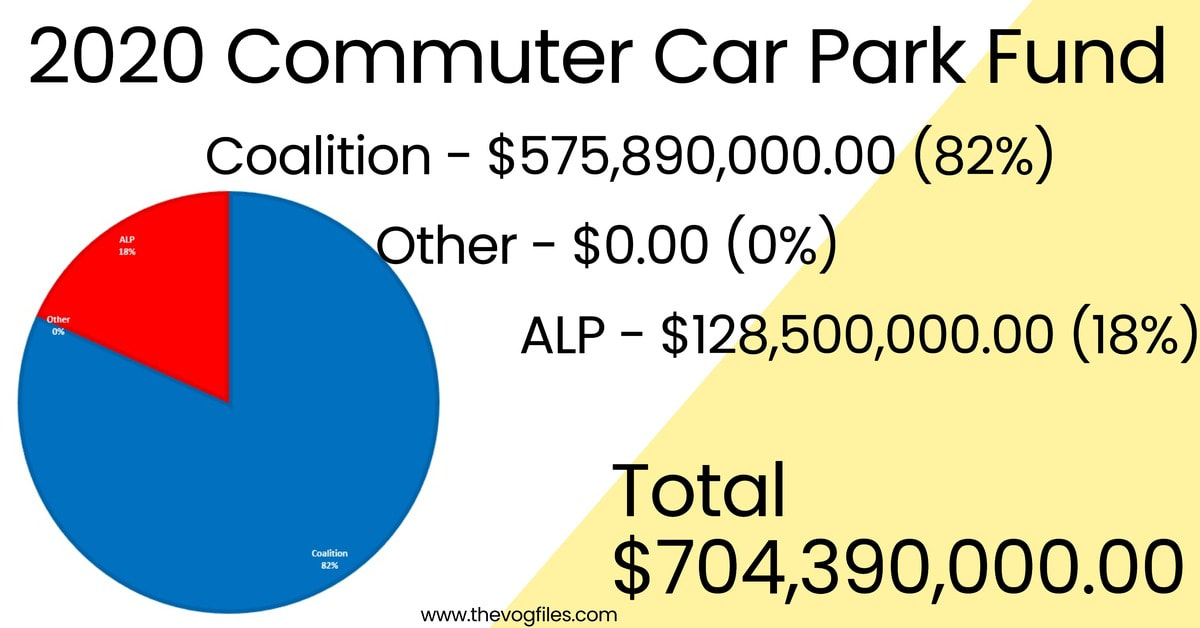
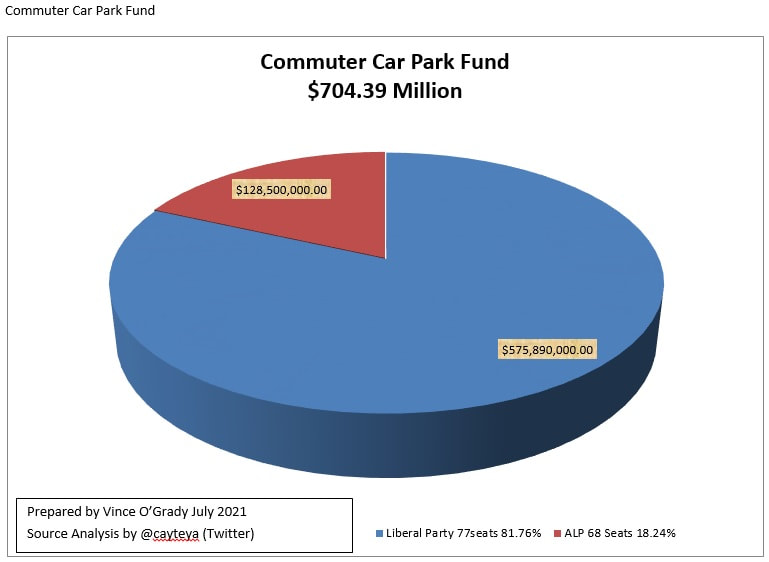
No 12. Commuter Car Park Fund.
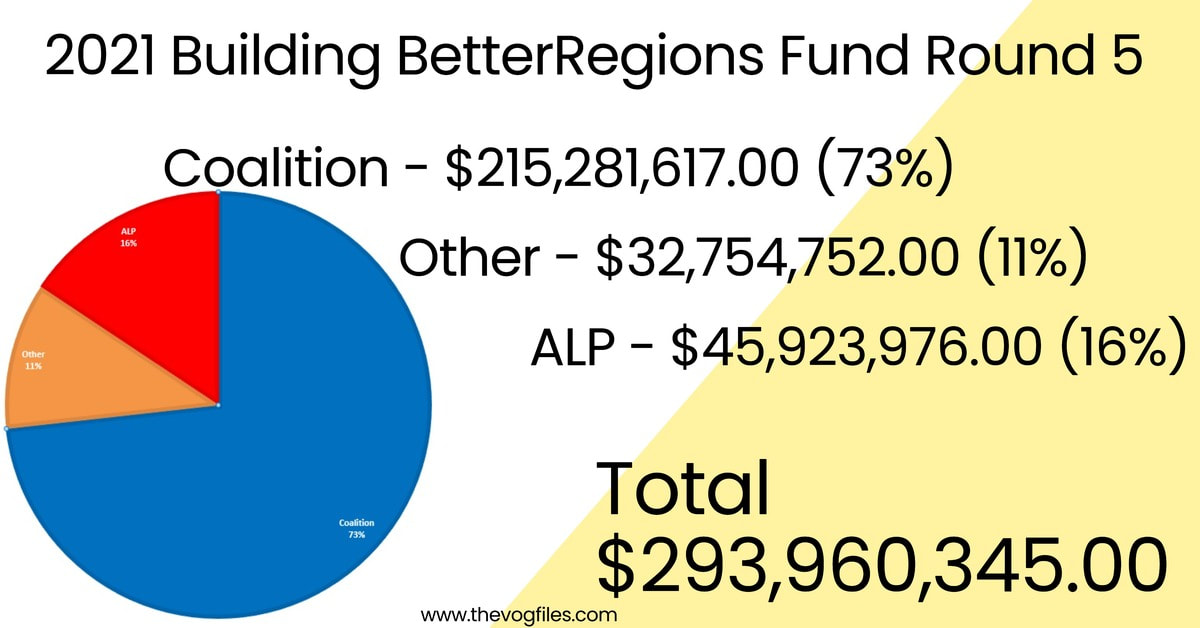
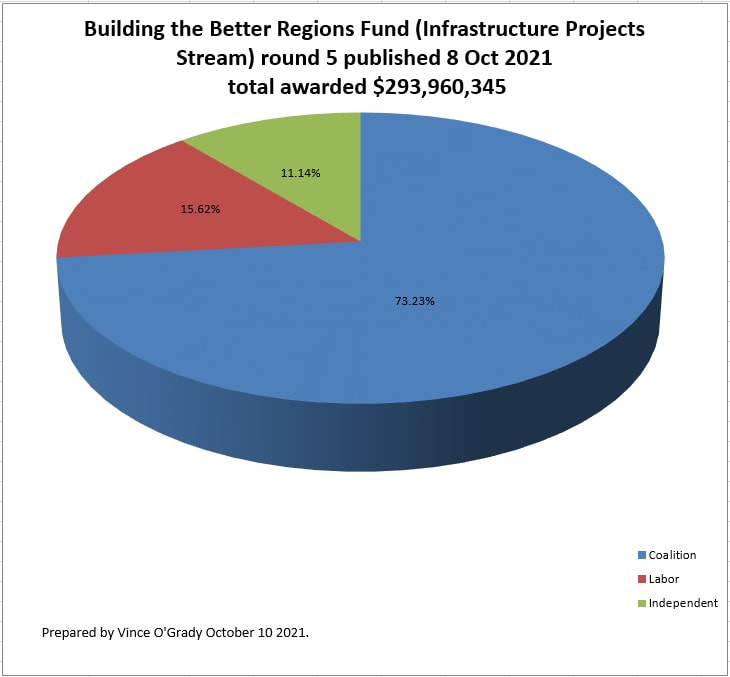
No 13. Building The Better Regions Fund. Rd 5. 2021. Being Audited by the Auditor General as we tweet.
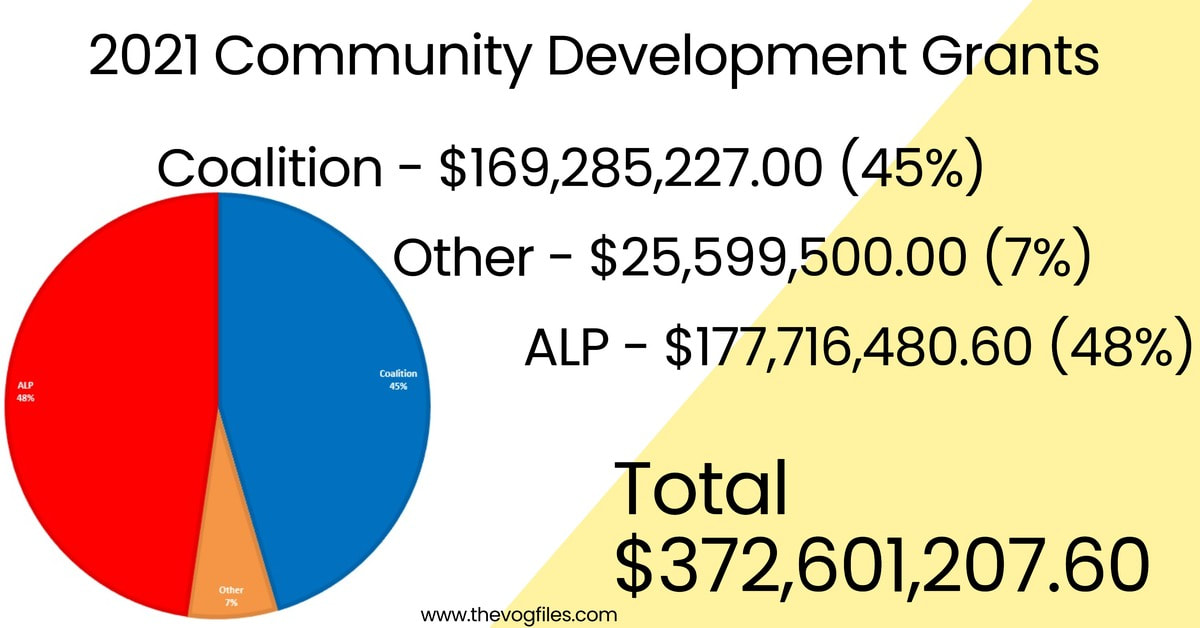
No 14. Community Development Grants 2021.
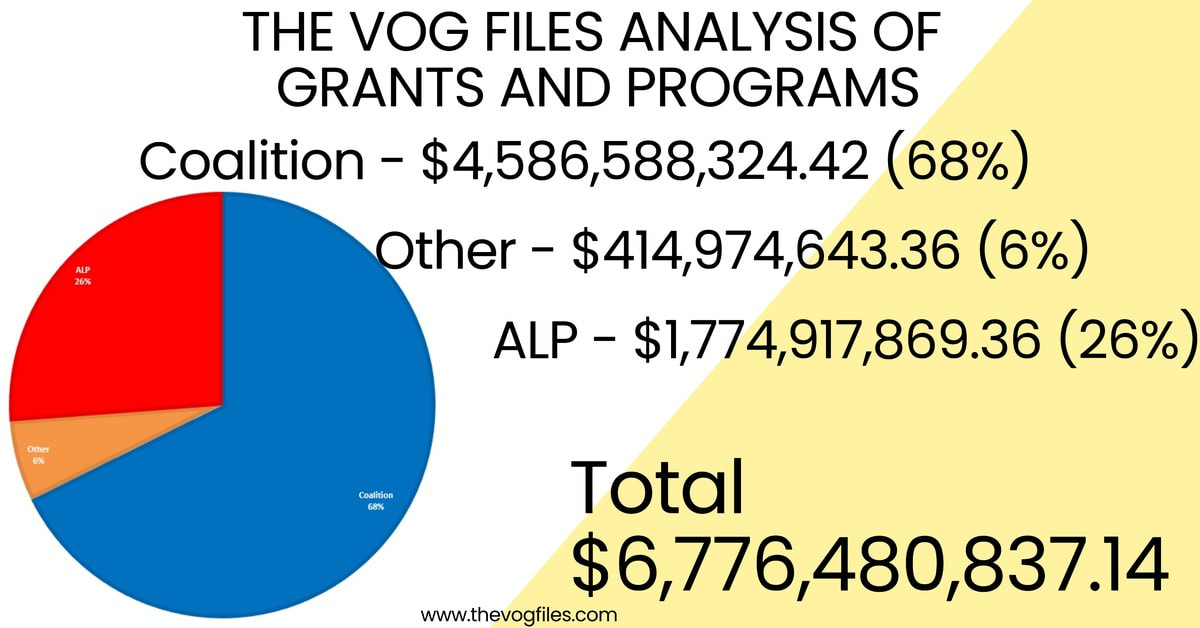
So after all of those proportional mismatches, where the Coalition seats got the majority of the funds here is the Total Analysis again.
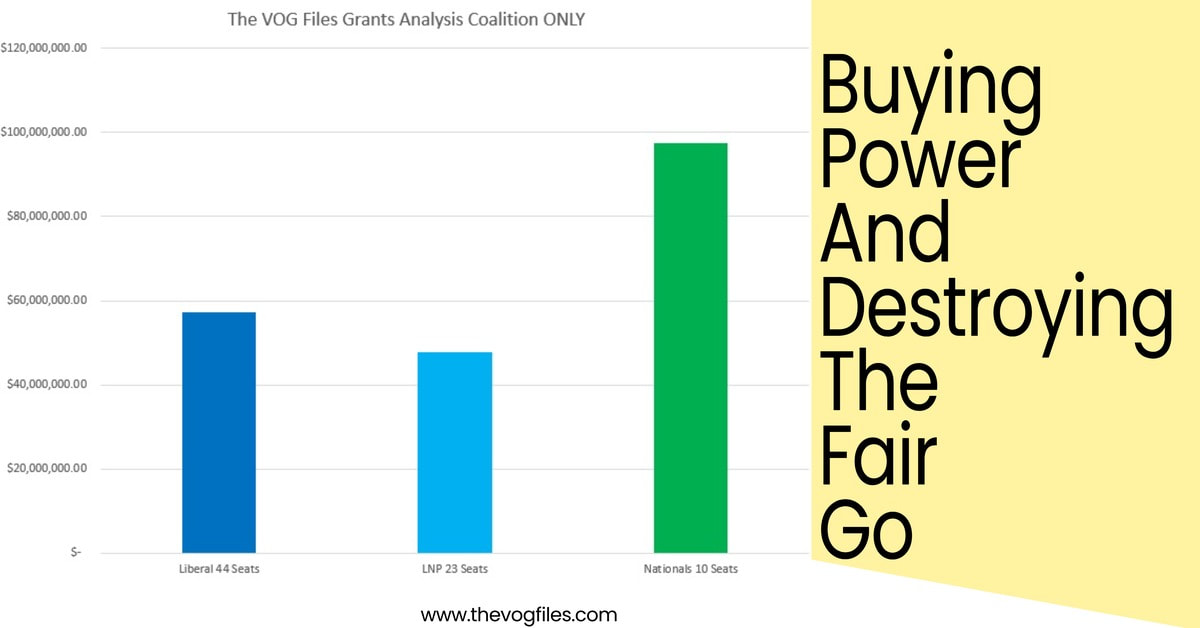
We ask again. "Where has the fair go Gone?" We at the http://thevogfiles.com believe that this distribution of funds is to re-elect the Coalition. The next two Slides show that in as stark a fashion as is possible. Firstly lets show you the coalition "Fair go"
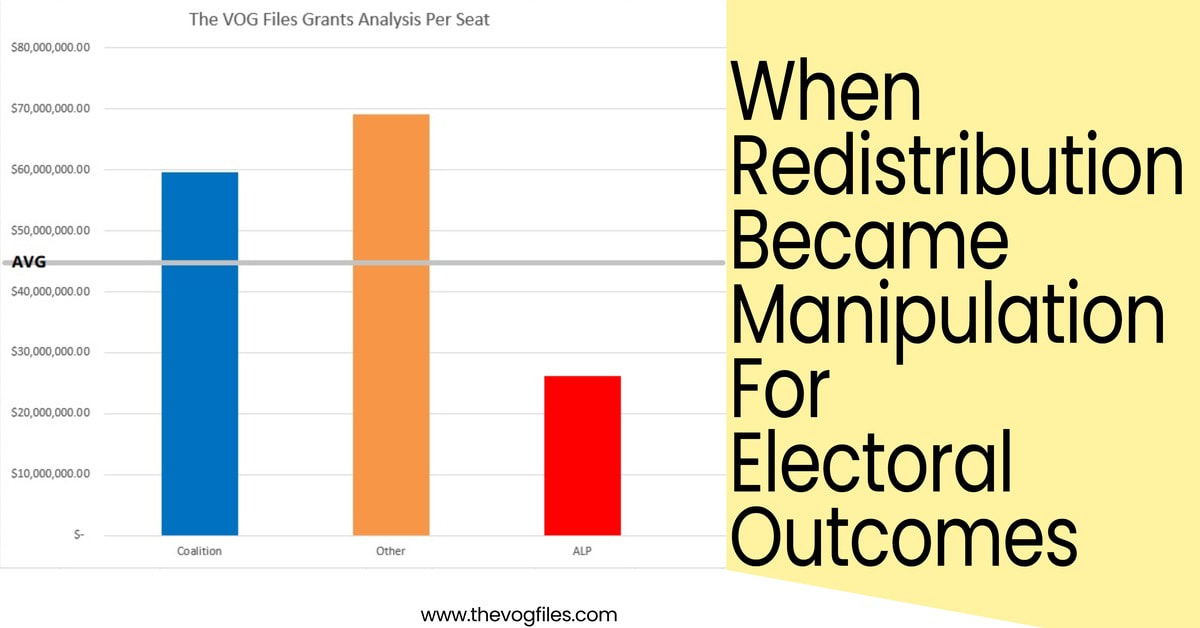
This slide shows how the coalition get onto the treasury benches. They shovel money at the Nationals seats. The party which gets them over the line and into government. The Average per seat for $6.7 billion was $44.8 million per seat. Yet the Nationals seats got an average of $97.4 million per seat, The LNP, $47.7 million per seat. The Liberals $57.1 million per seat and the ALP seats got an average of $26.1 million per seat. The Liberals have 44 seats, the LNP, 23 Seats and the Nationals 10 seats. Labor have 68. the party who control most of these grants is the Nationals through the Department of Infrastructure. that then brings us to the Second graph which we have called Manipulation. This shows the Average which should have gone to every seat.
This is all about about Integrity!
*Thanks to THE VOG FILES TEAM
*Thanks to THE VOG FILES TEAM
