|
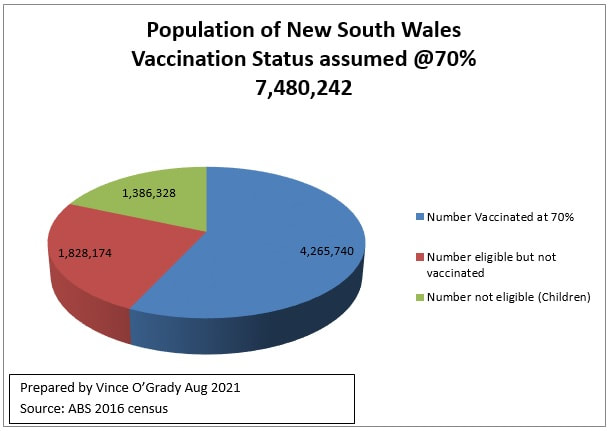
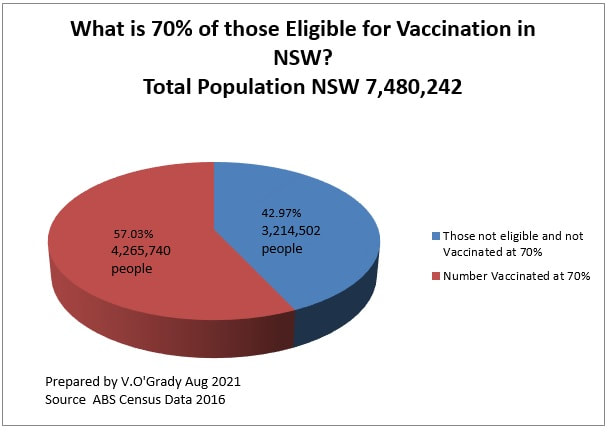
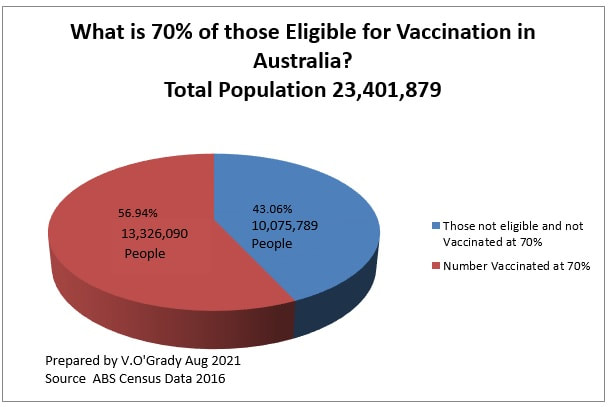
26/8/2021 ModellingWhat is a model? Models are combinations of variables about particular issues which can inform the community as to perceived outcomes when the variables are applied in a particular combination. Some variables are know from collected data, whilst some data isn’t known but a variable can still be assigned because we know at particular levels that variable may have a significant effect on the outcome of a model. The model therefore is a dynamic beast, able to be changed easily in light of new data and observed outcomes. So in the case of Covid 19, a novel virus which has been with us (the World) since December 2019 we have an enormous data set of the original strain of the virus. Transmissibility is a variable expressed as an R function, That can then be applied to a population and a number of infected people and how many people they infect be ascertained. From that and Data we can then see the hospitalisation rate, the ICU rate and the death rate. These are outcomes. Another variable into the model is the existing Hospital capacity, how much it is being utilised for a plethora of other diseases and Physical ailments and usage of those facilities. The outcome of these variables coupled with the infection rate will inform us as to the likely effect that a serious outbreak will have on other Health issues. New strains of the virus and their transmission rate can be adjusted by the Variable R. Which also takes into account the Age ranges who are most affected by the Virus. So the model is dynamic and changing as new data comes in. As well as the Data on infection rates and severity of health outcomes (by Age range) there is also the issue of long Covid and the opportunity cost of Health if the existing Health facilities such as Hospital beds, ICU beds and surge capacity be used. Also the issue of Staff and their usage and their infection rate and being furloughed. So a whole lot of variables. In effect the model enables the health scientist to put hypothetical cases to the model. To test the model and also to have some idea as to likely outcomes. The better the data and how extensive data is which goes into the model the better the output. Other variables in the model There are other variables which are also pertinent to the model and how we respond to this virus. These variables are the health and Social measures taken by Chief health officers to combat the outbreaks. These measures are based on a simple assumption. That the virus transmits itself between hosts by social mingling in a variety of settings. So the best way to beat it is for everyone to maintain a distance in their own bubble for the length of the infectious period of the virus. ie Total Isolation. However that is not the best response in terms of living and working in our society. Various State Governments and Territories have had a set of graduated responses to the virus and what to restrictions ask their citizens to adhere to. Including and by mixing them in groups toward full isolation. 1/ Mask wearing 2/ Social distancing 3/ Staying home and only leaving for 5 reasons 4/ When leaving for those 5 reasons staying within 5 kms of your home 5/ Not doing anything during those 5 reasons which is not specified in the 5 reasons. 6/ Curfew at home between certain times. 7/ Only essential workers working and special protocols in place at their work places 8/ Closure of Pubs and clubs 9/ Closure of restaurants 10/ Total Lockdown. So these measures are also a variable which can be quantified. Another variable is the TTIQ (Test Trace, isolate and Quarantine) which also has an effect on the spread of the Virus. The idea of Contact tracing is to find out from infected persons, where they have been and then trace others who have been in these places at the same time, to have them tested and then to isolate until a negative test is returned and/or to isolate for 14 days in the case of Primary contact. Another variable is the vaccination of the population and at what proportion. Coupled with this are the characteristics of the people who have been vaccinated. Do they still carry the Virus? Are they still transmitters? Are they still able to get sick with the virus and how bad is their illness. Does the Doherty model do all of this? The answer is I don’t know. But I suspect that the professionals at that institute built a pretty robust model. The Executive summary says the following. Stated objectives of the immunisation program enabling the transition to Phase B are to constrain severe outcomes within clinical capacity and reduce the intensity and length of requirement for socially and economically impactful public health and social measures. On page 12 of the Doherty report it says the objectives of the modelling were to. Objectives Objectives of the immunisation strategy to enable a transition from Phases A to B are: 1. Minimisation of moderate and severe health outcomes, defined as all identified cases leading to workforce absenteeism as well as that subset resulting in hospitalisation, intensive care requirement and death (to be constrained within national capacity for hospital ward and ICU admissions); and 2. Reduction of the intensity and length of application of socially and economically disruptive public health and social measures, which are currently the primary means of reducing transmission. Ongoing ‘light’ restrictions will likely be needed to augment vaccine impacts, but lockdowns would be deemed unlikely. So the Objective of the strategy is to meet a Government target. Following the Outbreaks of Mers and Sars and the number and seriousness of Novel Viruses in the last 20 years one would have expected a model to have been constructed along the lines that Doherty have done, with all the variables already in place to put the hypotheses in place and test that hypotheses with the model. In effect what the Government is saying the model says is that at 70% of the eligible population vaccinated (fully vaccinated) then it would be safe to open up the economy. This is a very poor misrepresentation of Science. What the model is actually doing is saying that at 70% vaccination rate, the expected transmission of the virus is In a tweet at 8.31pm on Aug 23 2021. The Doherty institute said. In the COVID-19 modelling, opening up at 70% vaccine coverage of the adult population with partial public health measures, we predict 385,983 symptomatic cases and 1,457 deaths over six months. Their next tweet in the thread (at the same time) said With optimal public health measures (and no lockdowns), this can be significantly reduced to 2,737 infections and 13 deaths. We’ve learned from watching countries that have removed all restrictions that there is no ‘freedom day’. The link to these tweets is here. https://twitter.com/TheDohertyInst/status/1429753057332502532?s=20 So the Doherty institute have done their scientific thing, placed the variables in the model and come up with two difference scenarios. The point about this is that the decision as to whether to open up is not theirs, it is the governments. The real Question is one of how much illness and death are the government willing to trade off for opening up. That is a political and Ideological decision not a scientific one. So now we move onto the maths of the 70%. What does it mean? Well 70% of the 2016 census population is explained by two methodologies in the Spreadsheet. At rows A78 to A85. As you can see this calculation is the difference between 857,745 persons in the eligible category not vaccinated if you use 70% of the whole population and 1,828,174 persons in the eligible category not vaccinated if you use 70% of the eligible population. I have used the Second method. Using this method it gives the following figure for those in the total population unvaccinated at 70% vaccination. 10,075,789 or 43.06% unvaccinated. This includes all children below aged 15. (I think I forgot this as a variable as well Age of eligibility as well as availability of vaccines.) I have also done another calculation which may be of interest to you in the email and who Gladys Berejiklian claims to have been vaccinated and their proportion in the eligible population of new South Wales. Commentary. The Number fully vaccinated at 70% means 8,531,480 vaccinations in arms. Different than the 6,000,000 Gladys is claiming. 70% of NSW’s eligible for jab is actually 57.03% of the Total population of NSW. 70% of Australian’s eligible for jab is actually 56.94% of the Total population Conclusion
What the Doherty model actually does is look at a range of variables which when placed in a Hypothetical way to the model will output a result. In this case being a number of infections and deaths with the major variable being the health measures applied. Those results are then for decisions by government and their respective chief health officers to weigh up the Infection/death levels they are willing to accept (or the community is willing to accept having been explained the circumstances) and how much the economic cost is going to be under each scenario. In effect the Health/Pandemic Modelling by Doherty will then be plugged into the Federal Government’s ideological/Economic Model to make a decision about opening up at 70% or 80%. The choice of the Punter in the street is whether they believe that the economic model has the robustness to stand up to Scientific peer review and then whether the conclusions made by the Federal government accord with their Ideological and economic ideas and ideals. Comments are closed.
|
AuthorThe VOG Files by Vince O'Grady Archives
July 2023
Categories |


 RSS Feed