|
A recap.
This was one of three welfare policies which were passed by Coalition government of Liberal Party and National parties in the 2015 federal budget. What was it’s genesis? This was a recommendation in a report by Andrew Forrest, the chair of Fortescue Metals in WA. He was asked to do the report by the then Prime Minister Tony Abbott. That report was entitled “The Forrest Review Creating Parity” and it made a raft of recommendations relating to First Nations People. Chapter 2 deals with a new idea called The Healthy Welfare card. This became the cashless Debit card under the Coalition government. To be fair to the report it said had some good initiatives, like Health and Education, leading to better health and job prospects in remote areas of Australia. Success for the Healthy Welfare Card was supposed to look like the following • Home and communities are illicit-drug free. • Homes where welfare dependency is common have very low alcohol consumption. • Families budget responsibly, rent is paid and school fees and school support is met normally. • Food and items needed to sustain healthy individuals are met before leisure. • Costs are incurred. • Welfare supports life’s essentials. The government accepted this part of the report and in 2015 developed a new policy called Social Security Legislation Amendment (Debit Card Trial) Bill 2015.The Parliamentary digest for the bill said the following.
Having completed a Business degree majoring in Marketing, everything we did had to be referenced back to an analysis of the Product and the marketplace. Sure assumptions had to be made but those assumptions had to be valid. We had to prove that such and such a product would do well in a particular segment because of a certain set of provable characteristics. So the first Question I would ask as a marketer in these circumstances is:- “What is the extent of Gambling, Alcohol use drug use in the Aboriginal community in Ceduna?” “What is the incidence of crime related to the use of Drugs and/or Alcohol and/or gambling?” “Would the introduction of a Cashless Debit card reduce Alcohol consumption, Drug usage or Gambling in the trial area?“ And a last question would be “would the introduction of the CDC reduce crime in the Area?” The very first thing I would do is to analyse the Trial Area. Let’s choose Ceduna. Using the Australian Bureau of Statistics data for the 2016 Census, we see that Ceduna has a population of 3408 people who were 49.5% male and 50.3% female. They were in 875 families in 2068 dwellings. The population consisted of 546 people over the age of 65 (CDC does not apply to them) and 746 persons under the Age of 15 (CDC would not be likely to apply to them either). So we have a population of 2116 who could be on some sort of Welfare benefit covered by the measure. 1395 people were either in full time or part time work and 55 people were unemployed. There were 866 Aboriginals in Ceduna. This is illuminating because the Ceduna trial had 757 people in Ceduna on the card. See page 5/17 of the Review of the Cashless Debit Card Trial in Ceduna and East Kimberley (East Kimberley had a total of 1247 people on the card). The Forrest review saw the card as integral to bring the First Nations people back to parity with the rest of Australia, including in Health and social outcomes such as incarceration. Yet the only part of the report that was really taken up was the Cashless Debit Card minus the name Forrest had given it, The Healthy Welfare card. Next we look at the statistics available for health in Ceduna. These are for the local hospital and can be found for Ceduna District health Service. They give hospital Statistics at a high level and cannot really be related to the instances of admission because of Alcohol, gambling or drug usage. The link back to gambling, drugs and alcohol is yet to be shown. Perhaps the reports do exist, I have yet to find them in existence, let alone being used to inform Government policy in this area. The next area we should look at is the crime statistics. They are available and in a form that can also be analysed to give us some idea of the types of crime committed in Ceduna. They can be found easily on line. With these I am going to analyse 3 years before the trial in Ceduna was implemented and 5 years during the trial. Offences against the person. These offences are
Year Number 2010 -2011 153 2012-2013 161 2014-2015 143 2015-2016 97 2016-2017 145 2017-2018 124 2018-2019 136 2020-2021 164 The trial was introduced in 2015 budget and did in fact show a reduction between 2014-15 of 46 offences against the person, which may well have been attributable to the introduction of the CDC. But in 2016-17 it shot up by 48 offences during that year. In 2020-2021 it was at it’s highest level of 164 offences in those 4 groups and the CDC trial was still in existence. Hard to say whether offences against the person were reduced by the trial looking at these figures. Other metrics I would like to have accessed were the levels of consumption of Alcohol and the levels of gambling as well. Also what other intervention policies were going on at the same times of the CDC and may well have required an evaluative input into whether the trials were working. Like the circumstances surrounding Robodebt and the justification of that scheme, it appears that an analysis of the actual target population was not done to the level required for new policy to be implemented. It is not enough for someone to write a report and propose a scheme without any data analysis and make conclusions that its introduction will make a substantial difference to the affected targeted First Nations people. Also the opportunity for other policies to affect social outcomes was not taken after IT WAS ESTABLISHED THAT THERE WAS A GAMBLING, DRUG AND ALCOHOL PROBLEM IN THE WHOLE OF THE TARGET POPULATION. Otherwise this policy looks and smells like what I suspect it was. Ideologically and racially driven. Like Robodebt no one was keeping these bastards honest. It’s a classic top down approach form entitled White Australia and highlights what happens when First Nations people don’t have a Voice and are not consulted about Policy which directly affects them. 13/7/2023 Why did Robodebt happen?It’s a funny thing that happens when people who we believe are credible tell us something.
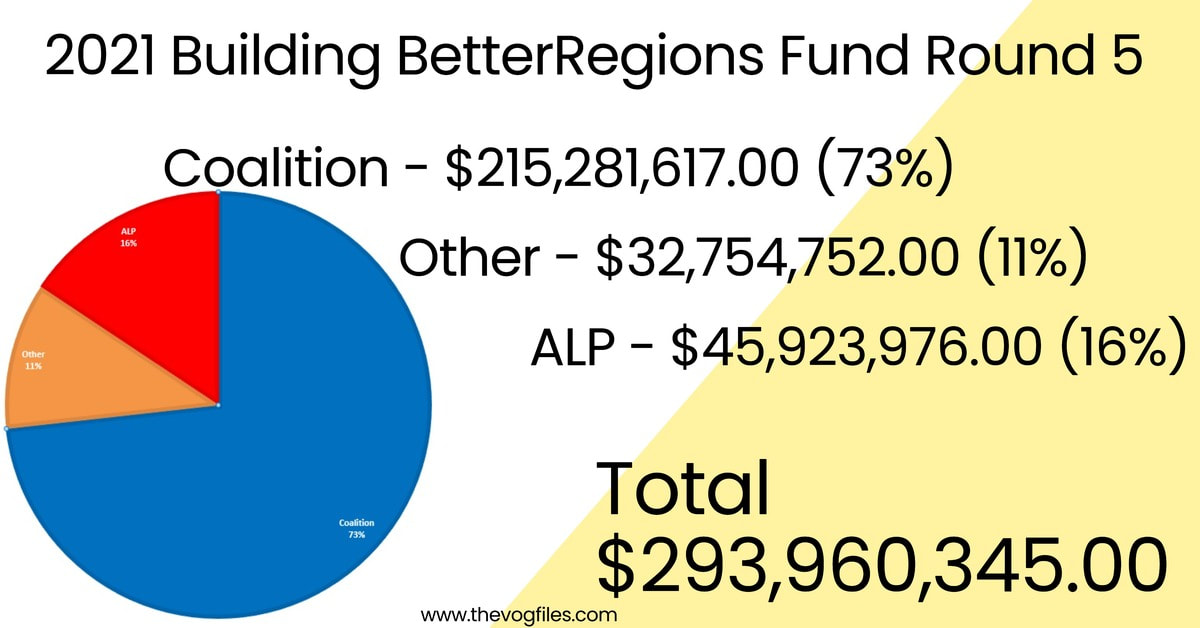
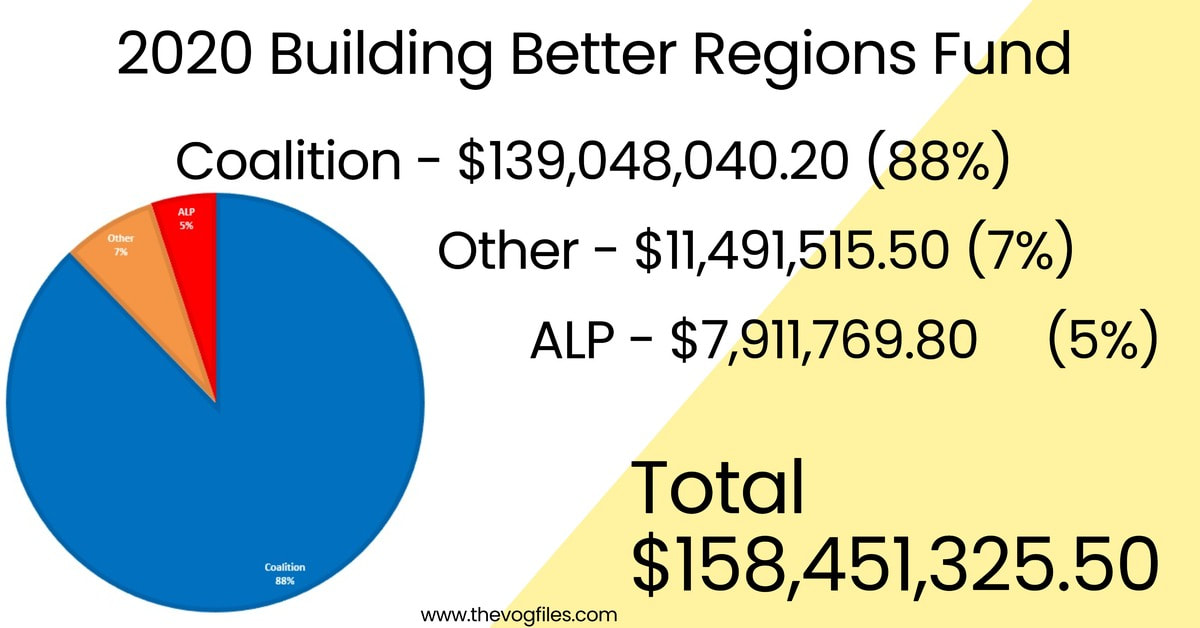
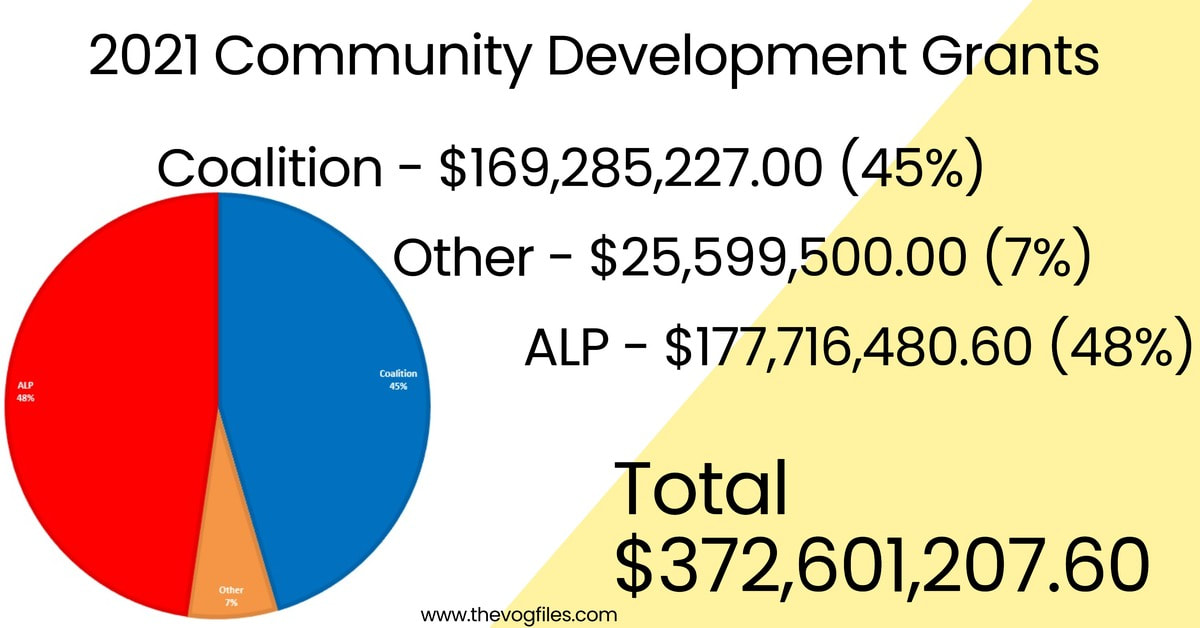
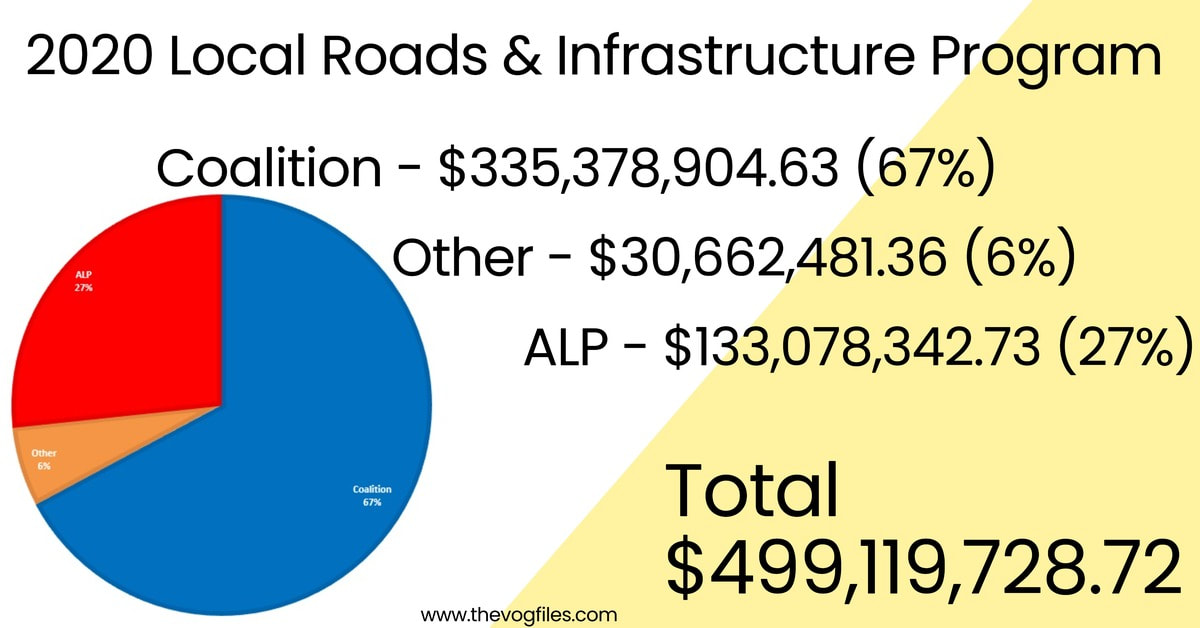
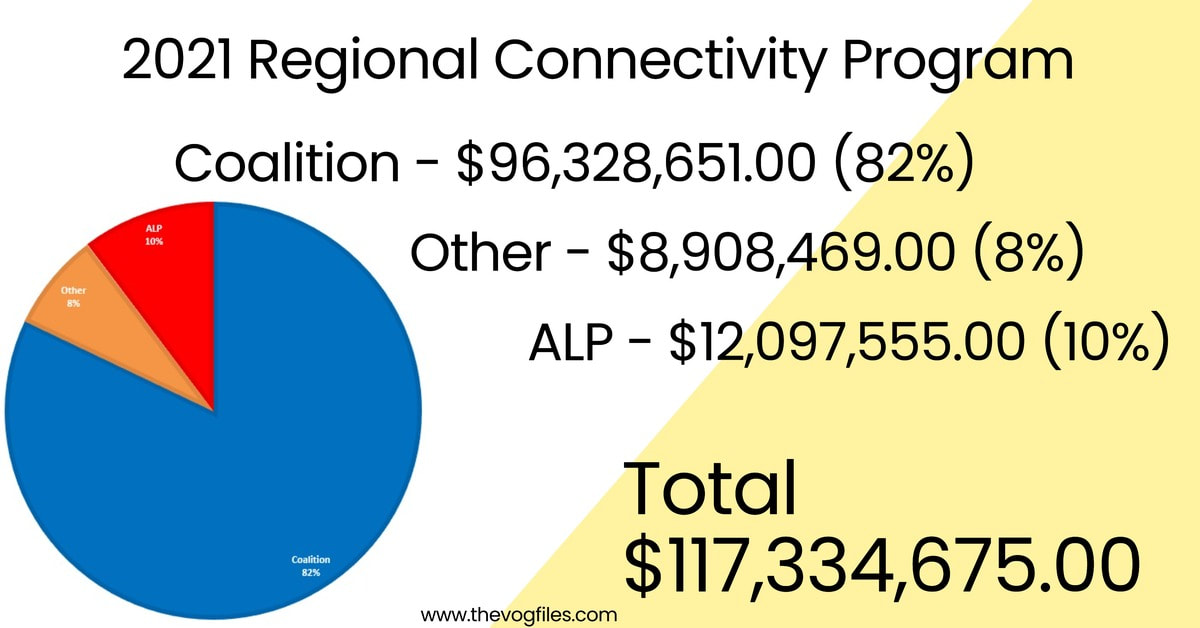
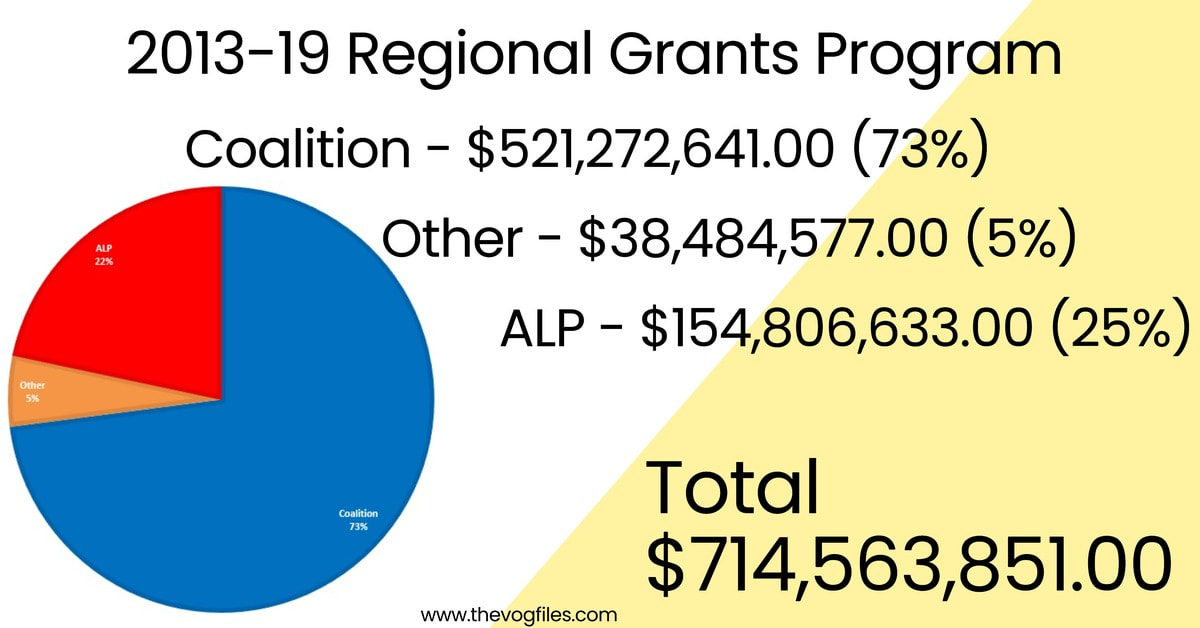
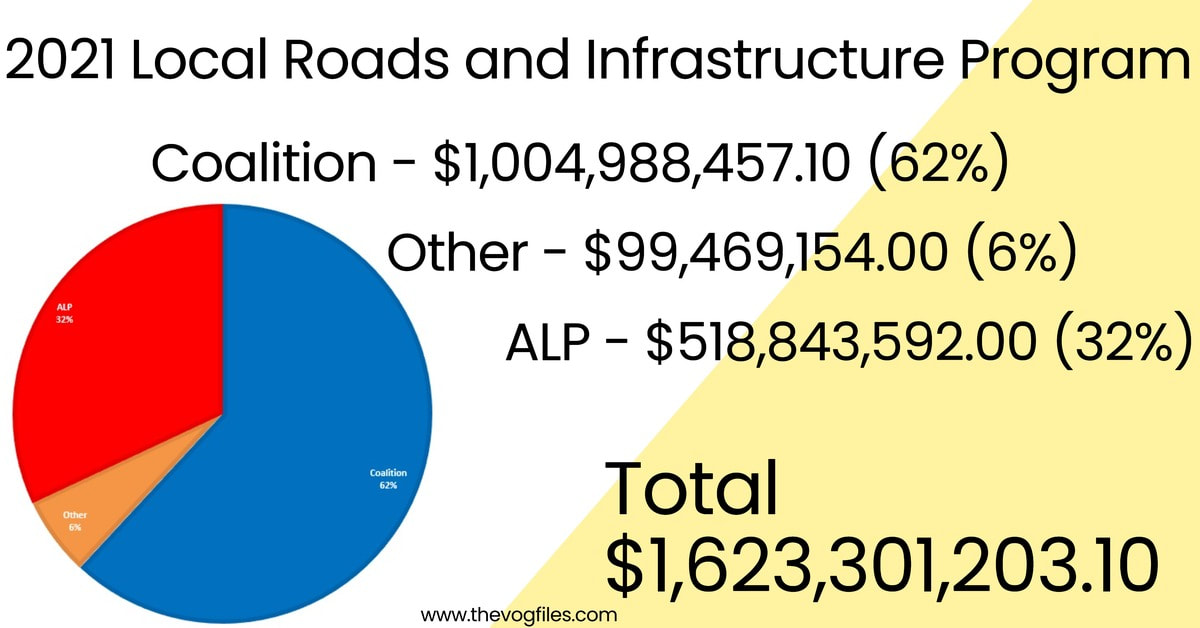
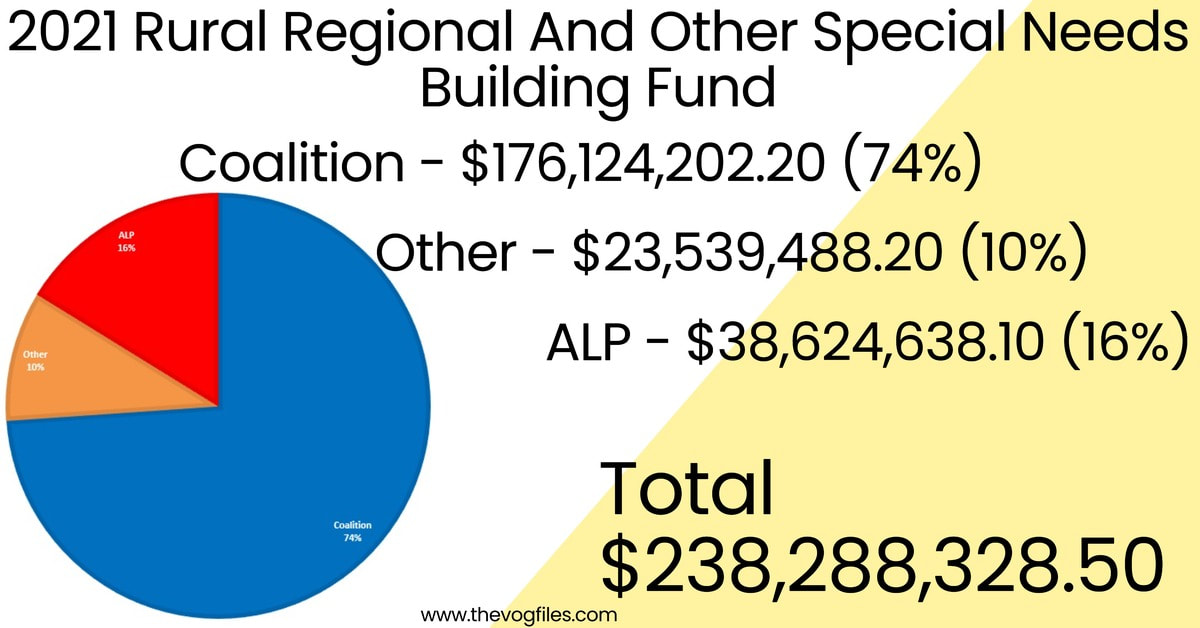
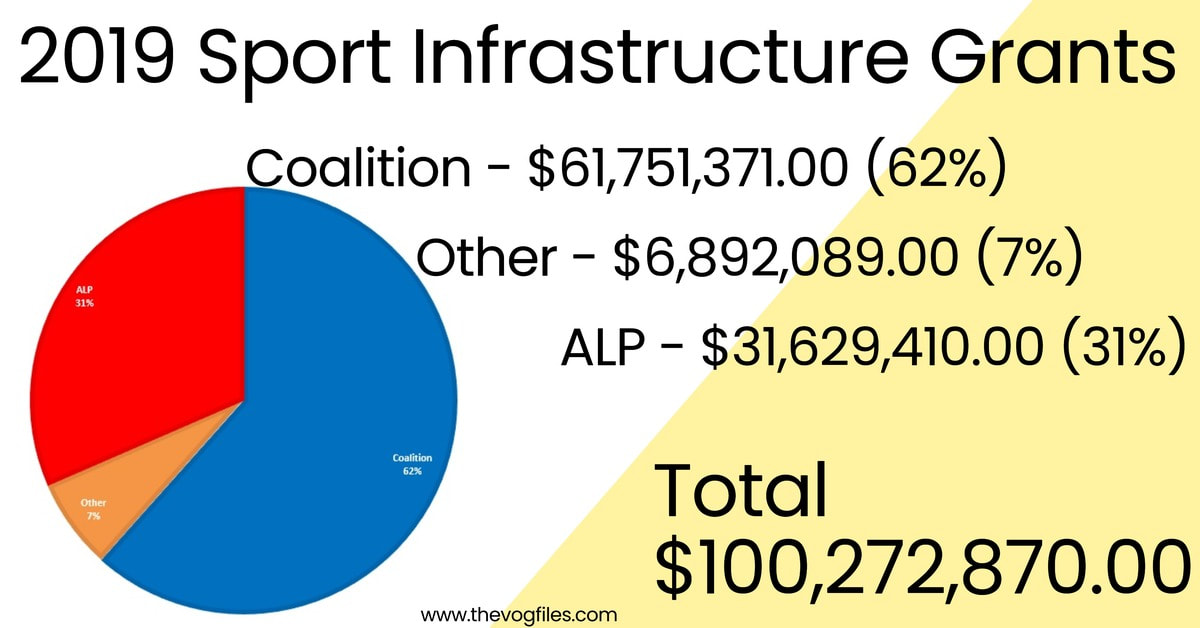
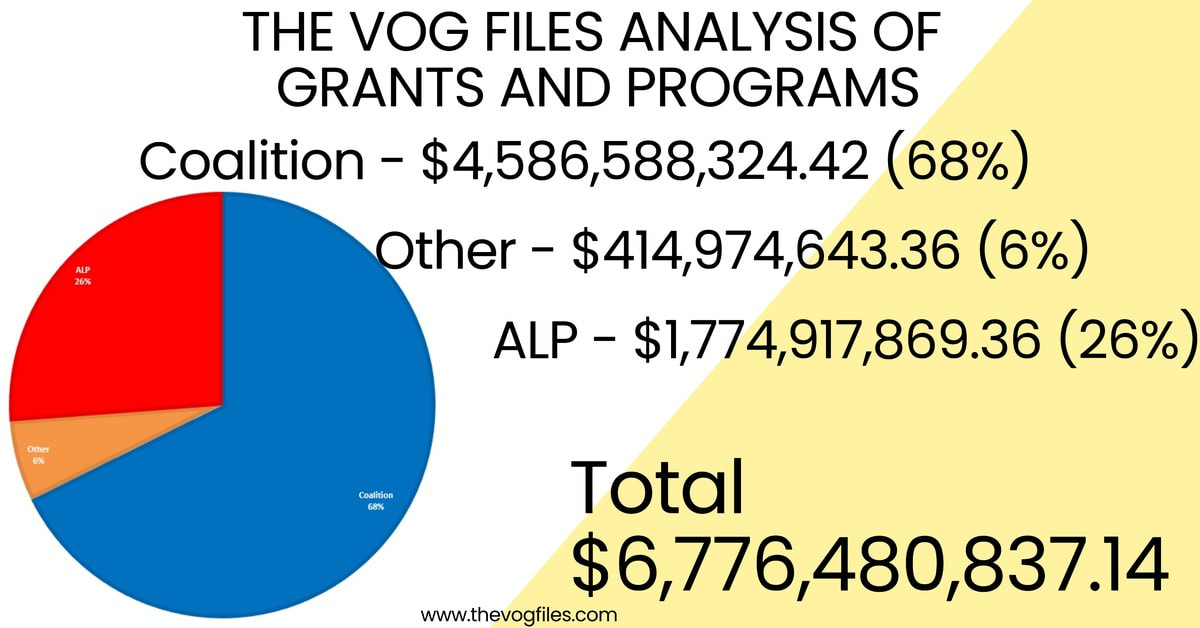
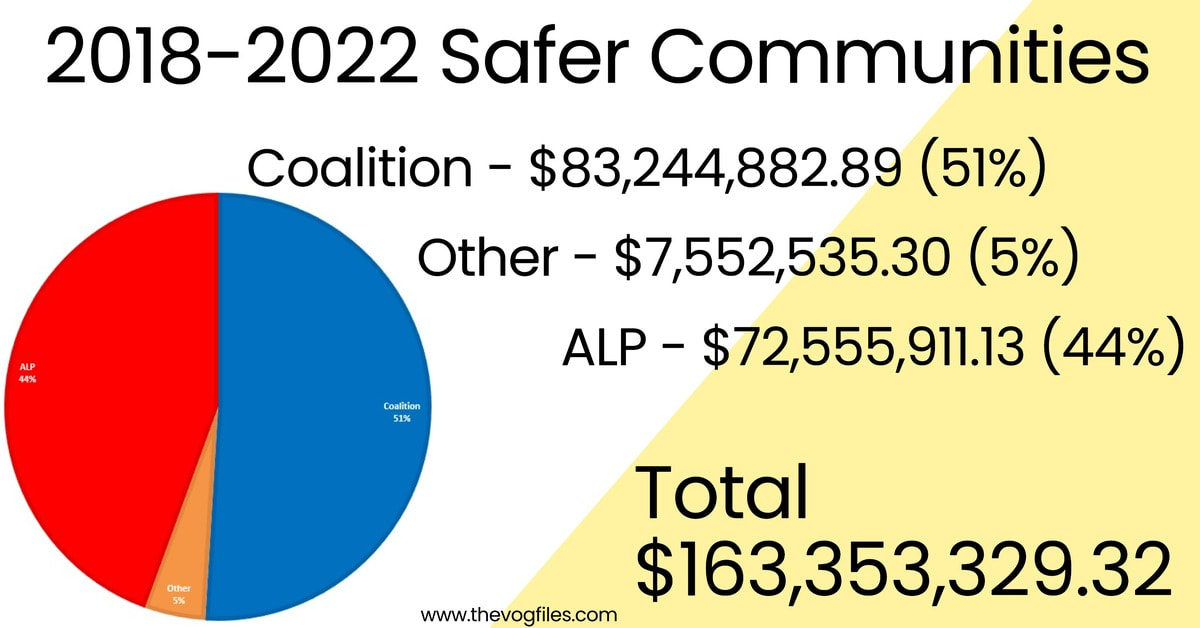
Lots of Australians believe Politicians. They trust them because that is what people do. They think they are there for the best of reasons. BUT in the case of the Conservative Governments which have infested our lives since late 2013 we were all wrong. Abbott started off by telling a pack of lies. “no cuts to education, health, or the ABC and SBS, and no changes to pensions” And then came the 2014 Budget, one of Austerity, which caused people to demonstrate in the streets. Joe Hockey famously said. ''the age of entitlement is over, and the age of personal responsibility has begun''. He and the finance minister sad on their fat entitled posteriors and smoked cigars outside the Australian Parliament. Just before the 2014 Budget. The changes to 1. Education were to cut $4.7 billion of funding from higher education over four years (Wikipedia) 2. Health, introduced $7 co-payment to see a bulk billing doctor, receive x-rays and get a blood test was proposed to save $3.4 billion over five years, however $5 of it will go toward medical research. All 61 Medicare Locals—organisations established to plan and fund extra health services—are going to close (Wikipedia) 3. ABC/ SBS. Funding for the ABC and SBS is being cut by 1% leading to costs savings of $43.5 million. Also The ABC's contract to operate the Australia Network was cancelled after its first year of a 10-year contract. (Wikipedia) 4. No changes to pensions. The indexation for pensions will be lowered from 2017 onwards, after it is linked to inflation rather than male average earnings (Wikipedia)A pretty comprehensive set of lies by Abbott. Yet in Abbott’s eyes Hockey failed to carry out the deal and in order to pass the Welfare reforms he had never taken to the people in September 2013, he brought in Scott John Morrison. Morrison had the ticker to do the job without fuss or bother. He was Abbott’s bully mate in Abbott’s bully gang. He was much more subtle than Hockey who led with his chin. Morrison led with his guile and he had plenty of that to go around. Abbott made him Minister for Social Services and he introduced three wide ranging policy changes with three enormous lies. We are now seeing the fruits of those policies and their failures. They were:- Robodebt. Where the lie was that over 860,000 welfare recipients had defrauded the Commonwealth. Morrison was the Welfare Sheriff. He was the sharpshooter at the saloon rounding up the cheats and fraudsters and threatening to put them in Jail. We all know how Robodebt ended after 4.5 years it was declared illegal and all the money and interest paid back to the people who had been sent debt notices. A Royal Commission has been held and it has just reported. The public service have a seriously red face and so do the politicians who instigated it, especially Morrison, yet he has said openly that the Commissioner, a Judge and Barrister had got it all wrong. The Cashless debit card. Where the lie was that all the people in the trial areas (thousands of people) were on drugs, were gambling addicts and were also alcoholics. They had 80% of their Welfare entitlements on the debit card and couldn’t buy Alcohol, and had to shop only at approved venues. The idea of the Coalition was to roll this out to all Welfare recipients and Aged Pensioners. Thankfully this awful policy has now been repealed. But we wrote about what the conservatives wanted to do here. https://www.thevogfiles.com/pensions-the-challenge-ahead.html Aged pensions Where the lie was that many aged pensioners were wealthy because they had huge assets. This potentially affected 3.6 million Australians. Morrison managed to convince the Greens political party (some sort of Quid pro Quo happened there but it was never revealed) to support them and they put at least 400,000 pensioners under the poverty line by the changes. This policy is described in detail in the attached document (see bottom of page). Policy like this is intricate and detailed and it’s easy to get lost in all the permutations, So Vince O’Grady wrote a spreadsheet model which incorporates all of the permutations which are also explained in the attached document. The document is a long read, it 22 pages long. Please feel free to download it and read it. This sort of approach is how this detailed policy work should be done. Under the Coalition it wasn’t. The model was offered to the Greens party along with a presentation of the intricacies of the policy and the variables. That offer was refused. The author Vince O’Grady did present it to two colleagues in the Labor party and those presentations lasted 2.5 and 3 hours respectively. What is the influence of the Press in all of this policy work? Very interesting question, which is also tied in with Question, Why did Robodebt happen? The Answer is simple. Journalists are not experts in the policy areas above and just repeat what they have been told by the politicians. Moreso than the Electors, the Journalists of Australia just believe what the politicians say. In the attached paper, I have a new definition for this phenomenon, it’s termed the Stump article. If a Journalist has no idea about an issue, they revert to what they think they know and just repeat it. Classic examples of this are housing and Taxation. All they write are motherhood statements about the Tax regime needs to change. They don’t explain how it needs to change and what part of it needs to change, why does it need to change? At thevogfiles we have actually looked at some of these issues and analysed them. The biggest one is corporate taxation and our findings can be read here. https://www.thevogfiles.com/taxing-times.html and guess what.... Yes there is a spreadsheet to download and study. Where are the spreadsheets the Journalists have done? Housing is the same. All the journalists write is about the State governments needing to release more land. They have had that stump article for 30 years or more. Not one of them has done any work on the Howard Government policy affect on house prices when they gave away $20,000 to new home buyers or for that matter the Abbott government “open for business” approach to selling residential homes through the Foreign investment review Board process, where the cashed up Chinese buyers bought Billions of dollars worth between 2013/4 and 2016, creating a shortage of houses for Australians and also increasing prices dramatically because of the fierce completion involved. Finally it would be remiss of me not to mention the largest Scandal in Australian political history largely ignored by Journalists in this country. I refer to the rorting of Commonwealth money in the approx $96 Billion of grants granted between 2013 and 2022 by the conservatives. https://www.thevogfiles.com/ have analysed over $7 billion of them and they show a really bad bias toward coalition seats. That Analysis with the evidence can be read here. https://www.thevogfiles.com/rorts-central.html So if there is a message to take away it is. Don’t believe everything you are told by the press and anything the Coalition tell you. Check your own sources. 5/7/2023 Pin the tail on the Pig.Want to play this game with me? If you do, choose your team carefully. The small team at thevogfiles.com have been at this for over two years now and we are very match fit. We also know the rules. They are: a) download the data b) analyse it c) if it smells of pork then pin the tail on the Pig d) Post the analysis so that the punters can see that we were not just playing let’s throw bullshit, which has a different set of rules and morals. If it doesn’t smell like Pork then go back to (a) download some more data and analyse it etc. One of the tactics of the people who don’t play by the Marquis of Pork rules is to throw in the “bothism” card. This is a rare card which has yet to be seen. It comes from lazy politicians who have been caught out playing throw the bullshit (other game) rather than pin the tail on the Pig. So who’s playing the bullshit (other game) now? Rex Patrick that erstwhile former Senator from South Australia. The man who believed he invented FOI, the investigator of Diary entries in the vain glorious hope that he will catch someone out. He has obviously been watching too many Gotcha questions by Murdoch journos. He’s found an ally in Michael West and they broke an amazing story replete with huge pictures of flying pink pigs. (The larger the pig the larger the scandal). The article is about Community batteries and the promises made by Labor before the 2022 election. Information they have never retracted or backed away from. Every political party makes promises and they may or may not be costed properly. They are normally associated with what that political party consider worthwhile policy. It’s a contest of ideas. We have this idea, vote for us as opposed to we have another idea vote for us. On the fence are the spoilers like Patrick who just snipes away at everyone and doesn’t come up with any sort of real ideas which would benefit the community. So this snipe is trying to say that Labor are pork barrelling the community battery scheme. He makes up his own version of what that really is. You may have noticed over the last two years www.thevogfiles.com have analysed over $7.4 billion in 17 specific grant schemes 15 of them were a bias toward Coalition Electorates. But that isn’t all that is wrong with them. Most of them ignore the grants rules and guidelines and the PGPA Act 2013. I suspect some of them are illegal because the right appropriation hasn’t been made in the budget or Appropriation bills. Patrick argues that these are an unveiling of a rort with associated colour spreadsheets. He says: “Pork barrelling is political corruption. It involves the expenditure of public funds, typically through a grant, to build infrastructure in a way that favours the interests of a political party, rather than in the public interest.” Is that the case? What is his evidence? He quotes his erstwhile colleague from Mayo who wanted to apply for these Battery opportunities. Who suggested the FOI. It links to another “bombshell” story in West’s publication where Sharkie has asked a question in parliament saying Solar Rorts – Federal Labor caught in $200 million pork barrelling scheme . So what is the reality? What was promised? That was apparent in the voluminous FOI disclosure log. They had promised 58 sites where they would fund community batteries. However those Grant requests would have to meet the Grants rules and guidelines as well as the Guidelines for the fund where they are specifically mentioned. All 58 of them. If you don’t meet the criteria then you don’t get the money. What transpired? Well as is www.thevogfiles.com MO we went to the grant connect portal and downloaded all the grants for the 2022 – 2023 financial year. We then put a filter on it and isolated the grants in this scheme. There were 52 grants. 50 of them in the guidelines (Scheme1) and 2 of them in Scheme 2. So 50 of the original 58 were granted grants. The scheme started on 30th Jan 2023 and applicants had 5 weeks to apply. The guidelines for application can be found on this page. https://business.gov.au/grants-and-programs/community-batteries-for-household-solar-stream-1 bottom of the page. How much were the Grants worth in total? The total value of the 52 grants was $27,109,369 NOT $200 million as claimed in the Patrick article. Here is a breakdown of the grants by political party. 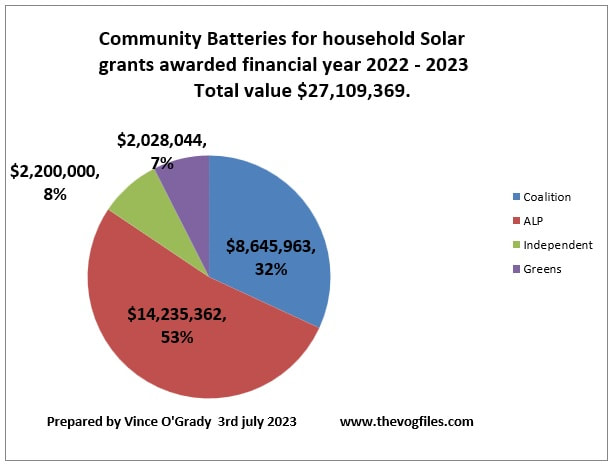 As usual we have placed the spreadsheet calculator on the website for downloading.
There is one difference between what we do at www.thevogiles.com and the likes of Rex Patrick and that is we play by the rules of evidence. We play Pin the tail on the Pig. Patrick failed miserably to Pin the tail on this Pig. I also feel a disclosure should be made at this time. Yes I am a Labor party member and proud of it. My health is such that I don’t any longer attend branch meetings and so these days I have very little to do with the party machinery. I wasn’t asked to do any of this work by any Labor party executive members or by any MP’s that I know. They are welcome, as are anyone who accesses my website to use the data to verify my writings. So if you want to have a go at me for being “rusted on” then go for it. Anyone who isn’t rusted on to Social justice “is a bum” (To quote Bob Hawke after Australia won the America’s cup and give it a twist). Unlike the Liberal, Centre Alliance and the Nationals, I like to play my political game of Pin the tail on the Pig with a straight bat (forgive the mixed metaphors.) I am told often that “they all do it” as yet I don’t believe you. Because you haven’t provided the necessary evidence to prove that Labor are corrupt only a poor attempt at a smear counting on no one doing the grunt work. End. Why Aston went to Labor? Some propositions.
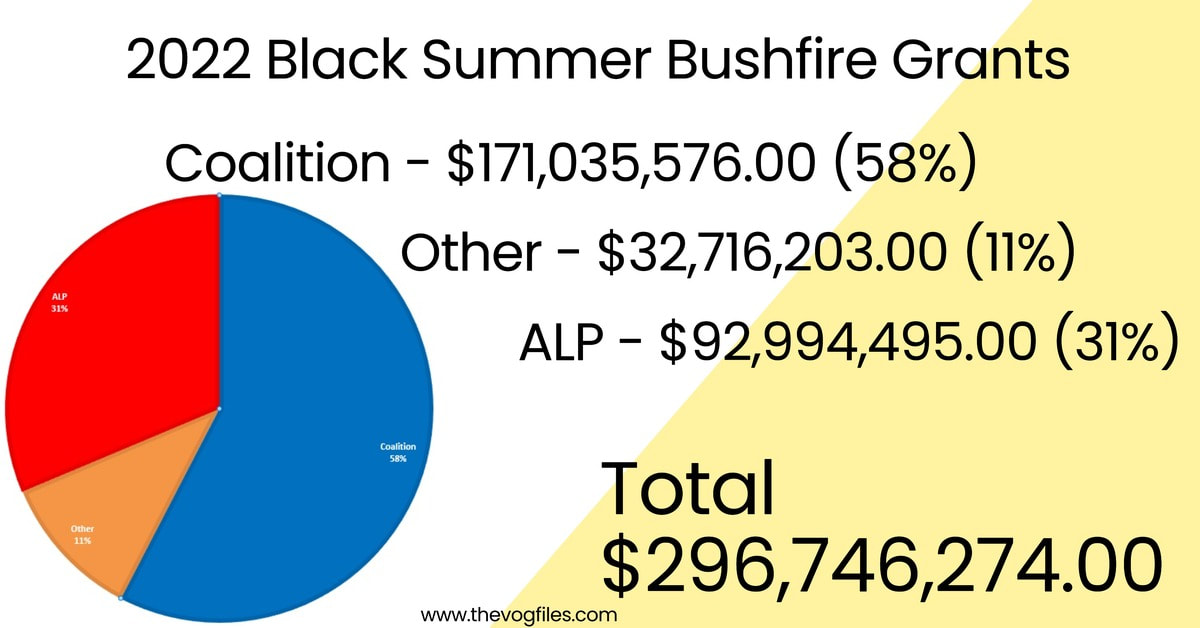
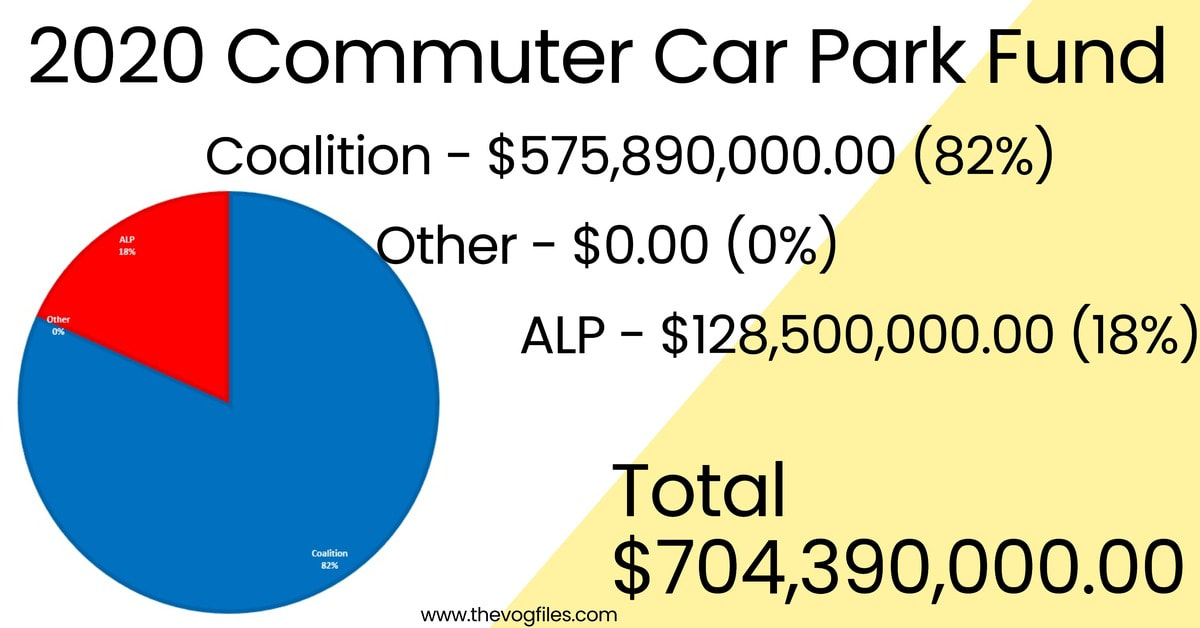
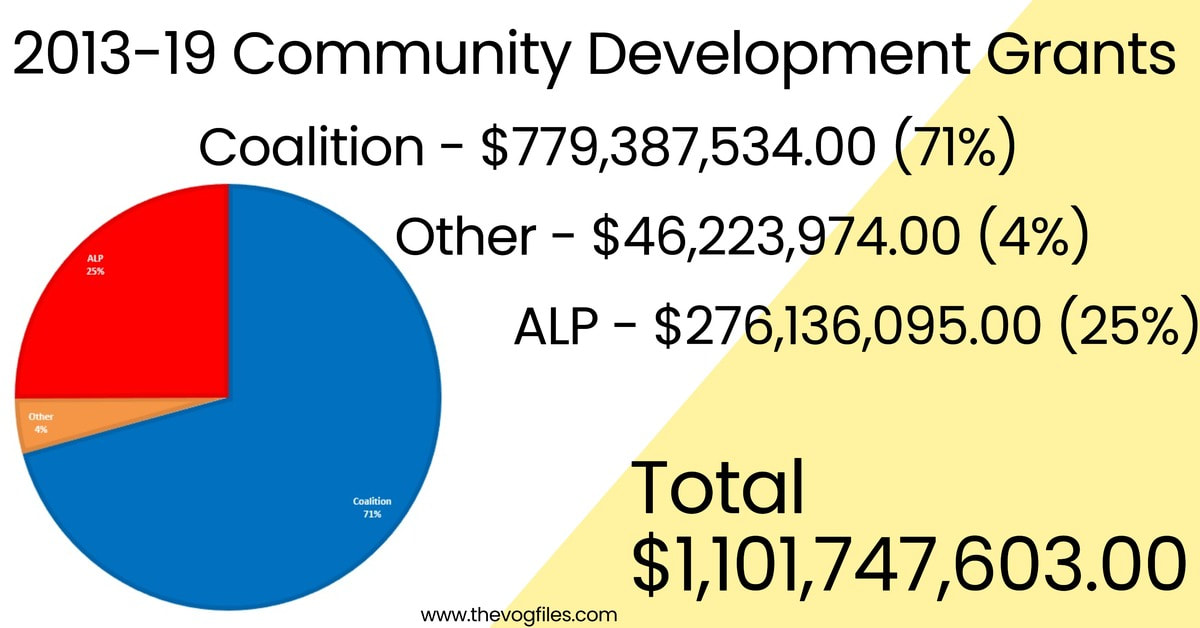
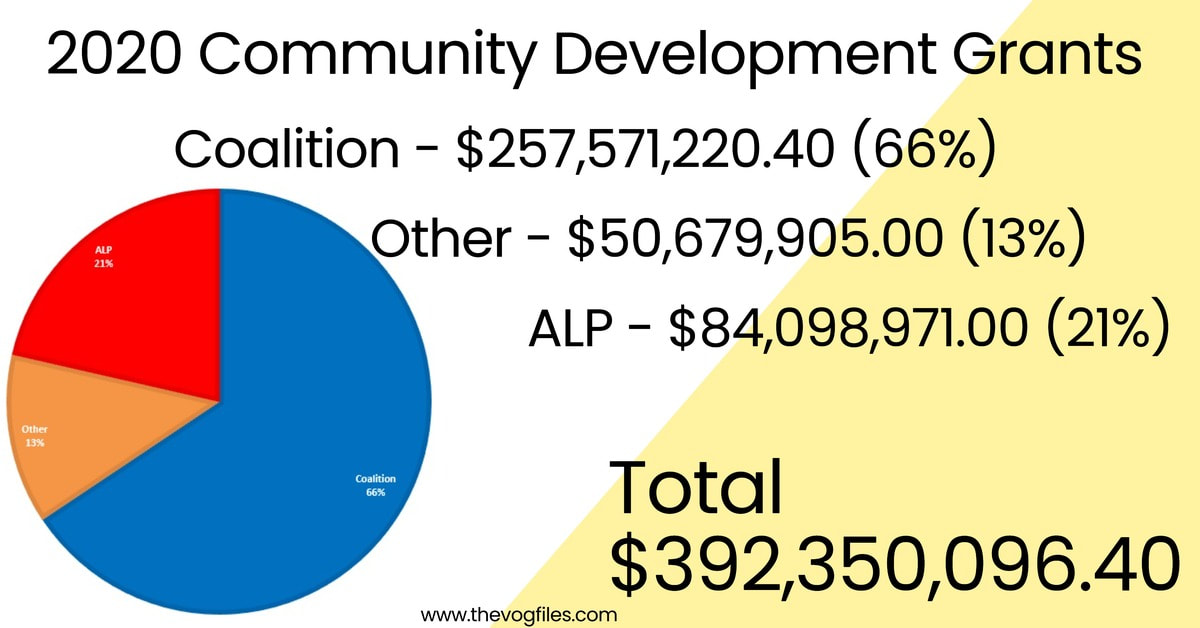
10 Years of Liberal/National Coalition. 1/ Tony Abbott lied about not changing Pensions, Medicare and funding for the SBS and ABC the night before the election. A slow burn to realisation of his lies. 2/ The 2014 Austerity budget. 3/ The expansion of offshore processing and the Secret Stop the boats Policy. Scott Morrison in Charge. 4/ The repeal of the Carbon Price which was working. The refusal to believe in Climate change. 5/ The closing down of Australian car Manufacturing with the loss of 200,000 jobs and skill base. 6/ The 2015 Budget which introduced a) the cashless debit card trials for Aboriginal parts of Australia, b) The changes to the way Assets are treated in the Aged Pension put 400,000 pensioners under the poverty line and c) The introduction of the Debt compliance initiative which became known as ROBODEBT. Scott Morrison in Charge. 7/ The destruction of a decent NBN network by Abbott and Turnbull and the silencing by intimidation of decent ABC reporting on the subject. Leaving Australians with a second class system. Not fit for purpose and expensive as hell for the user. 8/ The slow destruction of medicare by freezing the indexation of the rebate for doctors. 9/ Profligate spending on Grants and using grants funding as a way to get the Coalition reelected. Between 1 Jan 2018 and 21st May 2022 $88 billion was spent on Grants (Source Grants connect). www.thevogfiles.com analysed $7.4 Billion of these grants and showed that the majority of the funds were granted to Liberal, National and Supporting Independent electorates. See https://www.thevogfiles.com/rorts-central.html 10/ Profligate spending without Tender or reason with a grant to the Great Barrier Reef Foundation, an inconsequential organisation of 5 persons. $444 million awarded by Malcolm Turnbull 11/ Scott Morrison and his Gish Gabble approach to gaslighting the electorate non stop. 12/ Scott Morrison and his complete disregard for Australians being burned out whilst he Holidayed in Hawaii and coved up that holiday until he was found out. 13/ After the 2022 election the incumbent Alan Tudge and the further revelations about Alan Tudge and his extra Marital affair and the huge payout (again Secret) of $680,000 to the woman he had an affair with. 14/ After the 2022 election the constitution of the Robodebt Royal Commission and the evidence given by Alan Tudge which showed little remorse for the people his Government had caused so much harm to in the Australian Community. Highlighting the illegality of the scheme and the incompetence of the Coalition government which hurt vulnerable Australians so badly. 15/ Alan Tudge resigning in disgrace after giving his evidence at the Robodebt Royal Commission. In his Valedictory speech he said the thing he was most proud of was the changes to the social Security system. Since Labor won in 2022. (10 Months). 16/ A Labor party who actually have policies and work with other parties proactively to help Australians by passing the following reforms. a) Integrity. Passed the Integrity Bill to establish the National Anti Corruption Commission b) Wages. Supported wage rises for low paid workers and it worked. c) Climate change. Passed a Bill to Legislate the Climate change target. d) Environment. Passed the Nature repair market Bill with the support of the NFF to protect the environment e) Manufacturing. Passed a bill to establish the National Reconstruction fund. For Australian made and Australian jobs and skills. f) Education. Early childhood education reform g) Education. Upgrading skills shortages by fee free TAFE courses. h) Climate change. Safeguard mechanism reforms passed through Parliament. i) Wages and Social development. Passed the Gender Pay Gap Bill. j) Cost of living. Negotiating a code of conduct with the Gas suppliers to help keep the cost of Gas lower in Australia than international markets. k) Foreign Affairs. Repaired the relationship with France after the Coalition broke the contract for submarines. l) Foreign Affairs. Repaired the relationship with Pacific Islands people which was fraught under the Coalition.
26/8/2021 ModellingWhat is a model? Models are combinations of variables about particular issues which can inform the community as to perceived outcomes when the variables are applied in a particular combination. Some variables are know from collected data, whilst some data isn’t known but a variable can still be assigned because we know at particular levels that variable may have a significant effect on the outcome of a model. The model therefore is a dynamic beast, able to be changed easily in light of new data and observed outcomes. So in the case of Covid 19, a novel virus which has been with us (the World) since December 2019 we have an enormous data set of the original strain of the virus. Transmissibility is a variable expressed as an R function, That can then be applied to a population and a number of infected people and how many people they infect be ascertained. From that and Data we can then see the hospitalisation rate, the ICU rate and the death rate. These are outcomes. Another variable into the model is the existing Hospital capacity, how much it is being utilised for a plethora of other diseases and Physical ailments and usage of those facilities. The outcome of these variables coupled with the infection rate will inform us as to the likely effect that a serious outbreak will have on other Health issues. New strains of the virus and their transmission rate can be adjusted by the Variable R. Which also takes into account the Age ranges who are most affected by the Virus. So the model is dynamic and changing as new data comes in. As well as the Data on infection rates and severity of health outcomes (by Age range) there is also the issue of long Covid and the opportunity cost of Health if the existing Health facilities such as Hospital beds, ICU beds and surge capacity be used. Also the issue of Staff and their usage and their infection rate and being furloughed. So a whole lot of variables. In effect the model enables the health scientist to put hypothetical cases to the model. To test the model and also to have some idea as to likely outcomes. The better the data and how extensive data is which goes into the model the better the output. Other variables in the model There are other variables which are also pertinent to the model and how we respond to this virus. These variables are the health and Social measures taken by Chief health officers to combat the outbreaks. These measures are based on a simple assumption. That the virus transmits itself between hosts by social mingling in a variety of settings. So the best way to beat it is for everyone to maintain a distance in their own bubble for the length of the infectious period of the virus. ie Total Isolation. However that is not the best response in terms of living and working in our society. Various State Governments and Territories have had a set of graduated responses to the virus and what to restrictions ask their citizens to adhere to. Including and by mixing them in groups toward full isolation. 1/ Mask wearing 2/ Social distancing 3/ Staying home and only leaving for 5 reasons 4/ When leaving for those 5 reasons staying within 5 kms of your home 5/ Not doing anything during those 5 reasons which is not specified in the 5 reasons. 6/ Curfew at home between certain times. 7/ Only essential workers working and special protocols in place at their work places 8/ Closure of Pubs and clubs 9/ Closure of restaurants 10/ Total Lockdown. So these measures are also a variable which can be quantified. Another variable is the TTIQ (Test Trace, isolate and Quarantine) which also has an effect on the spread of the Virus. The idea of Contact tracing is to find out from infected persons, where they have been and then trace others who have been in these places at the same time, to have them tested and then to isolate until a negative test is returned and/or to isolate for 14 days in the case of Primary contact. Another variable is the vaccination of the population and at what proportion. Coupled with this are the characteristics of the people who have been vaccinated. Do they still carry the Virus? Are they still transmitters? Are they still able to get sick with the virus and how bad is their illness. Does the Doherty model do all of this? The answer is I don’t know. But I suspect that the professionals at that institute built a pretty robust model. The Executive summary says the following. Stated objectives of the immunisation program enabling the transition to Phase B are to constrain severe outcomes within clinical capacity and reduce the intensity and length of requirement for socially and economically impactful public health and social measures. On page 12 of the Doherty report it says the objectives of the modelling were to. Objectives Objectives of the immunisation strategy to enable a transition from Phases A to B are: 1. Minimisation of moderate and severe health outcomes, defined as all identified cases leading to workforce absenteeism as well as that subset resulting in hospitalisation, intensive care requirement and death (to be constrained within national capacity for hospital ward and ICU admissions); and 2. Reduction of the intensity and length of application of socially and economically disruptive public health and social measures, which are currently the primary means of reducing transmission. Ongoing ‘light’ restrictions will likely be needed to augment vaccine impacts, but lockdowns would be deemed unlikely. So the Objective of the strategy is to meet a Government target. Following the Outbreaks of Mers and Sars and the number and seriousness of Novel Viruses in the last 20 years one would have expected a model to have been constructed along the lines that Doherty have done, with all the variables already in place to put the hypotheses in place and test that hypotheses with the model. In effect what the Government is saying the model says is that at 70% of the eligible population vaccinated (fully vaccinated) then it would be safe to open up the economy. This is a very poor misrepresentation of Science. What the model is actually doing is saying that at 70% vaccination rate, the expected transmission of the virus is In a tweet at 8.31pm on Aug 23 2021. The Doherty institute said. In the COVID-19 modelling, opening up at 70% vaccine coverage of the adult population with partial public health measures, we predict 385,983 symptomatic cases and 1,457 deaths over six months. Their next tweet in the thread (at the same time) said With optimal public health measures (and no lockdowns), this can be significantly reduced to 2,737 infections and 13 deaths. We’ve learned from watching countries that have removed all restrictions that there is no ‘freedom day’. The link to these tweets is here. https://twitter.com/TheDohertyInst/status/1429753057332502532?s=20 So the Doherty institute have done their scientific thing, placed the variables in the model and come up with two difference scenarios. The point about this is that the decision as to whether to open up is not theirs, it is the governments. The real Question is one of how much illness and death are the government willing to trade off for opening up. That is a political and Ideological decision not a scientific one. So now we move onto the maths of the 70%. What does it mean? Well 70% of the 2016 census population is explained by two methodologies in the Spreadsheet. At rows A78 to A85. As you can see this calculation is the difference between 857,745 persons in the eligible category not vaccinated if you use 70% of the whole population and 1,828,174 persons in the eligible category not vaccinated if you use 70% of the eligible population. I have used the Second method. Using this method it gives the following figure for those in the total population unvaccinated at 70% vaccination. 10,075,789 or 43.06% unvaccinated. This includes all children below aged 15. (I think I forgot this as a variable as well Age of eligibility as well as availability of vaccines.) I have also done another calculation which may be of interest to you in the email and who Gladys Berejiklian claims to have been vaccinated and their proportion in the eligible population of new South Wales. 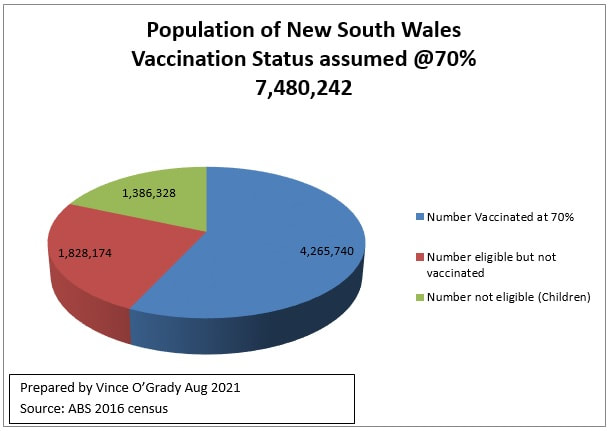 Commentary. The Number fully vaccinated at 70% means 8,531,480 vaccinations in arms. Different than the 6,000,000 Gladys is claiming. 70% of NSW’s eligible for jab is actually 57.03% of the Total population of NSW. 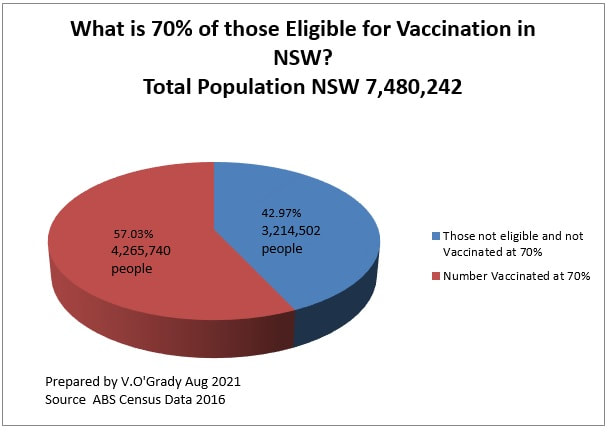 70% of Australian’s eligible for jab is actually 56.94% of the Total population 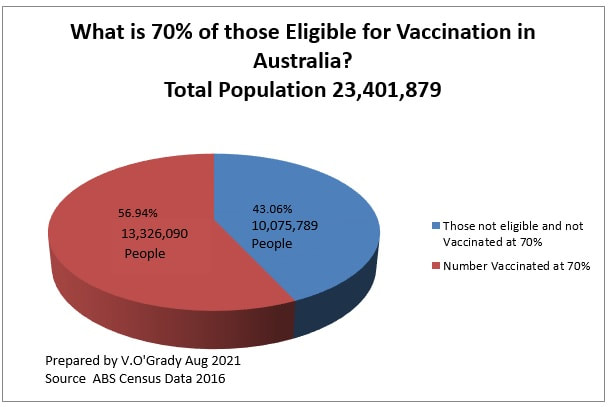 Conclusion
What the Doherty model actually does is look at a range of variables which when placed in a Hypothetical way to the model will output a result. In this case being a number of infections and deaths with the major variable being the health measures applied. Those results are then for decisions by government and their respective chief health officers to weigh up the Infection/death levels they are willing to accept (or the community is willing to accept having been explained the circumstances) and how much the economic cost is going to be under each scenario. In effect the Health/Pandemic Modelling by Doherty will then be plugged into the Federal Government’s ideological/Economic Model to make a decision about opening up at 70% or 80%. The choice of the Punter in the street is whether they believe that the economic model has the robustness to stand up to Scientific peer review and then whether the conclusions made by the Federal government accord with their Ideological and economic ideas and ideals. |
AuthorThe VOG Files by Vince O'Grady Archives
July 2023
Categories |

 RSS Feed